DataCourse project2025
Workout Calorie Prediction
A full machine-learning study of 20,000 workout sessions across eleven model families, and the audit that showed why its best score was too good to be true.
- 20,000
- Workout sessions, 54 columns
- 0.997 → 0.65
- Test R² as submitted, then without the leaked feature
- 21
- PCA components for 95% of variance
Timeline
Fall 2025, report Dec 2025
Role
Co-author: modelling, evaluation and report
Team
Two, with Gursahib Singh
Domain
Health and fitness · Wearables
Status
Course project
Stack
Source
Section 01
Overview
Can calories burned in a workout be predicted from heart rate, session and body measurements, and which kind of model does it best? For our machine learning course at Thompson Rivers University, Gursahib Singh and I built a seven-stage Python pipeline that covers the whole syllabus: data quality, exploratory analysis, PCA, decision trees, ensembles, regularisation, SVMs, neural networks, classification, clustering and cross-validation.
Section 02
Data and Exploration
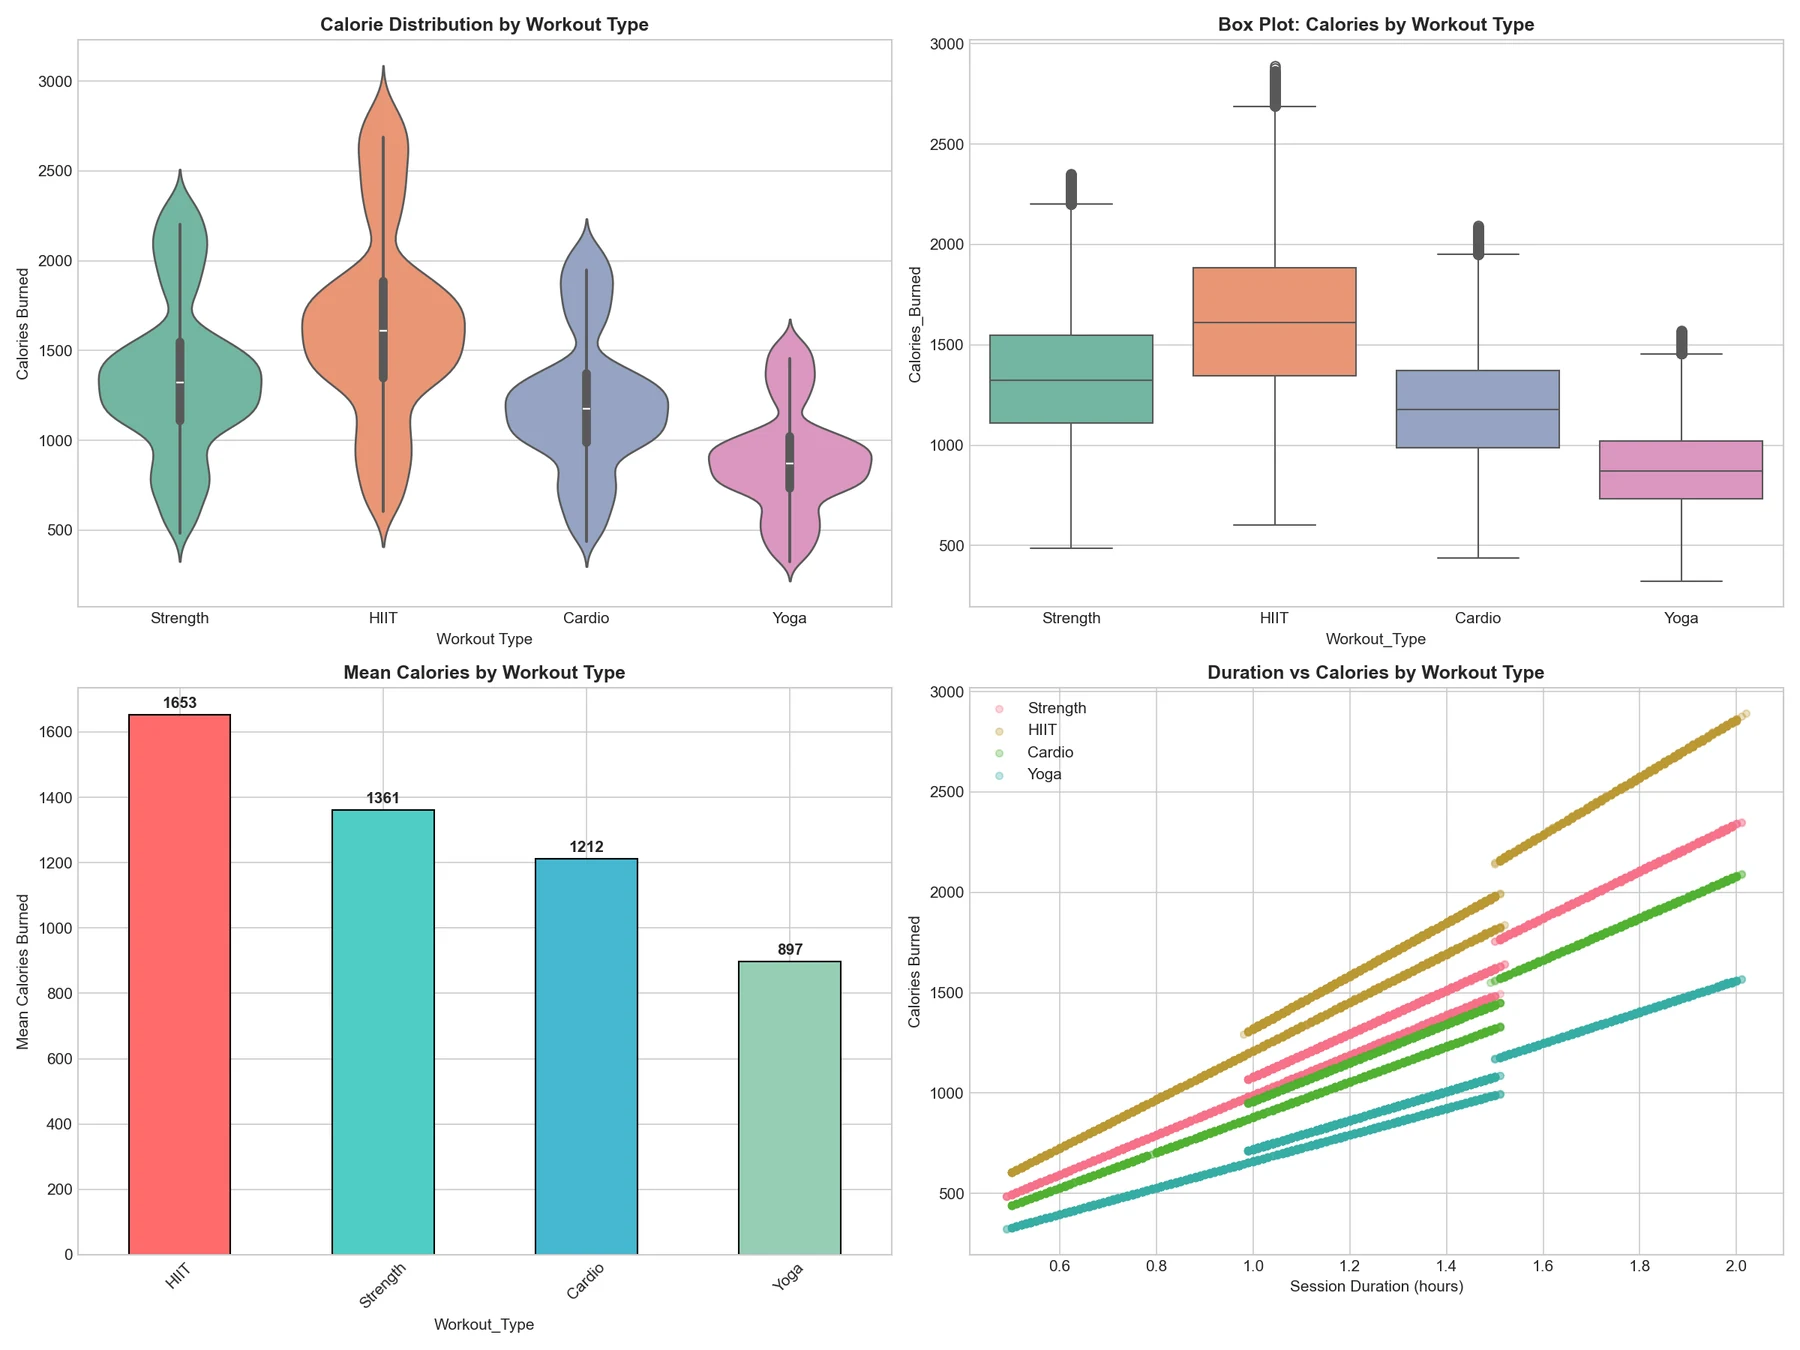
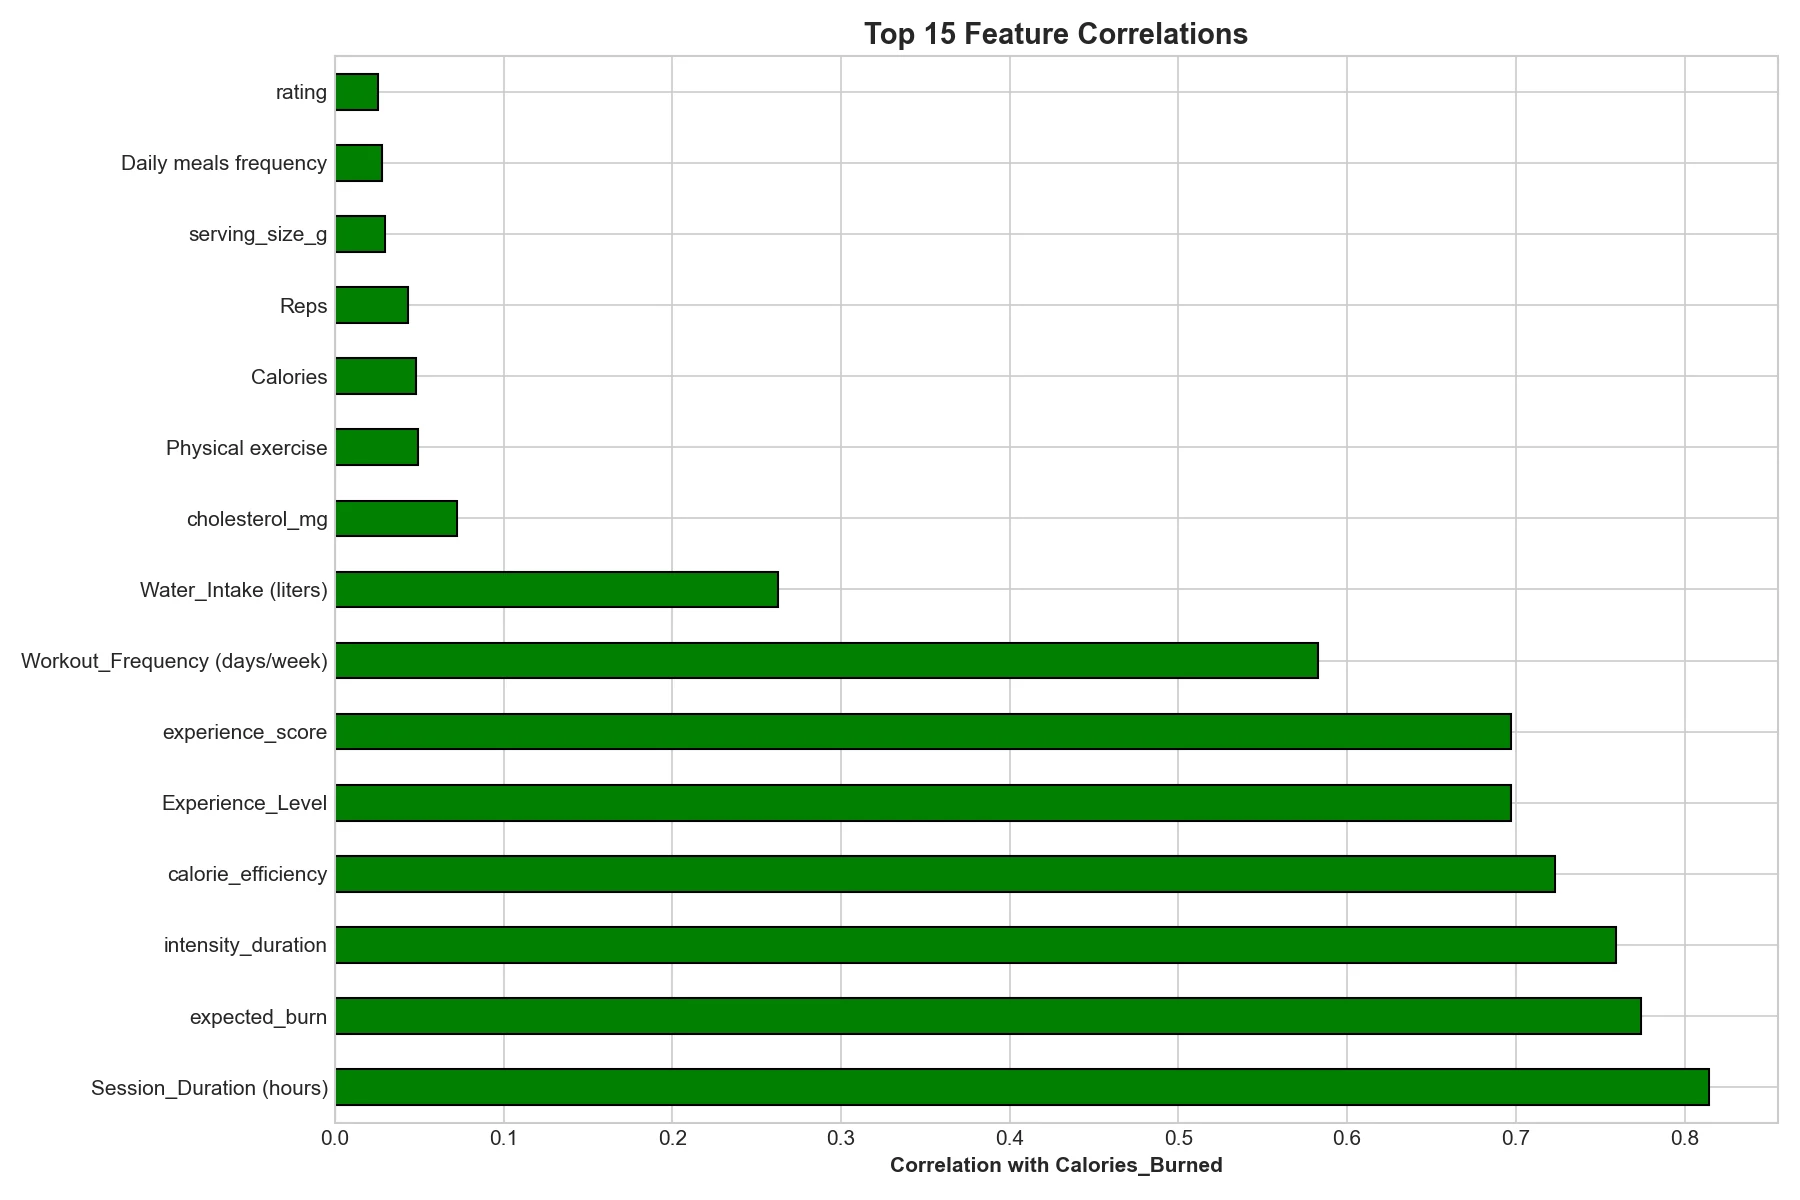
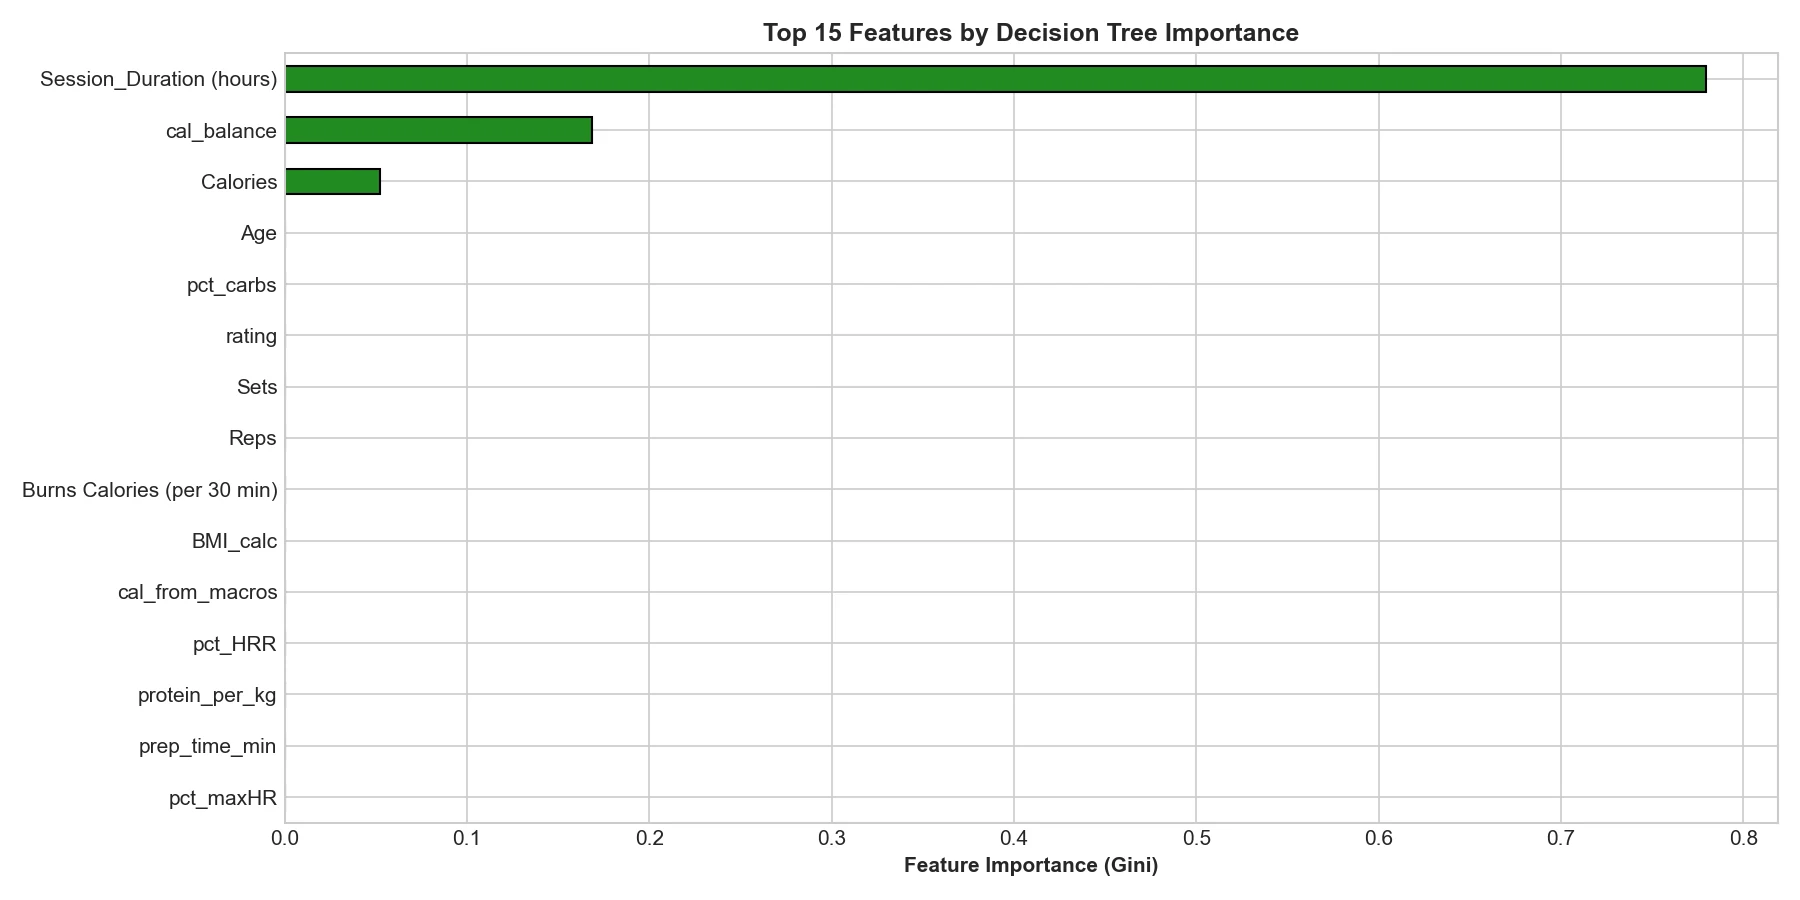
The Kaggle dataset has 20,000 sessions and 54 columns with no missing values. HIIT sessions averaged 1,653 calories against 897 for yoga, and an ANOVA confirmed the workout-type effect (p < 0.001) while diet type had none (p = 0.36). Session duration had the strongest correlation with calories burned (0.81).
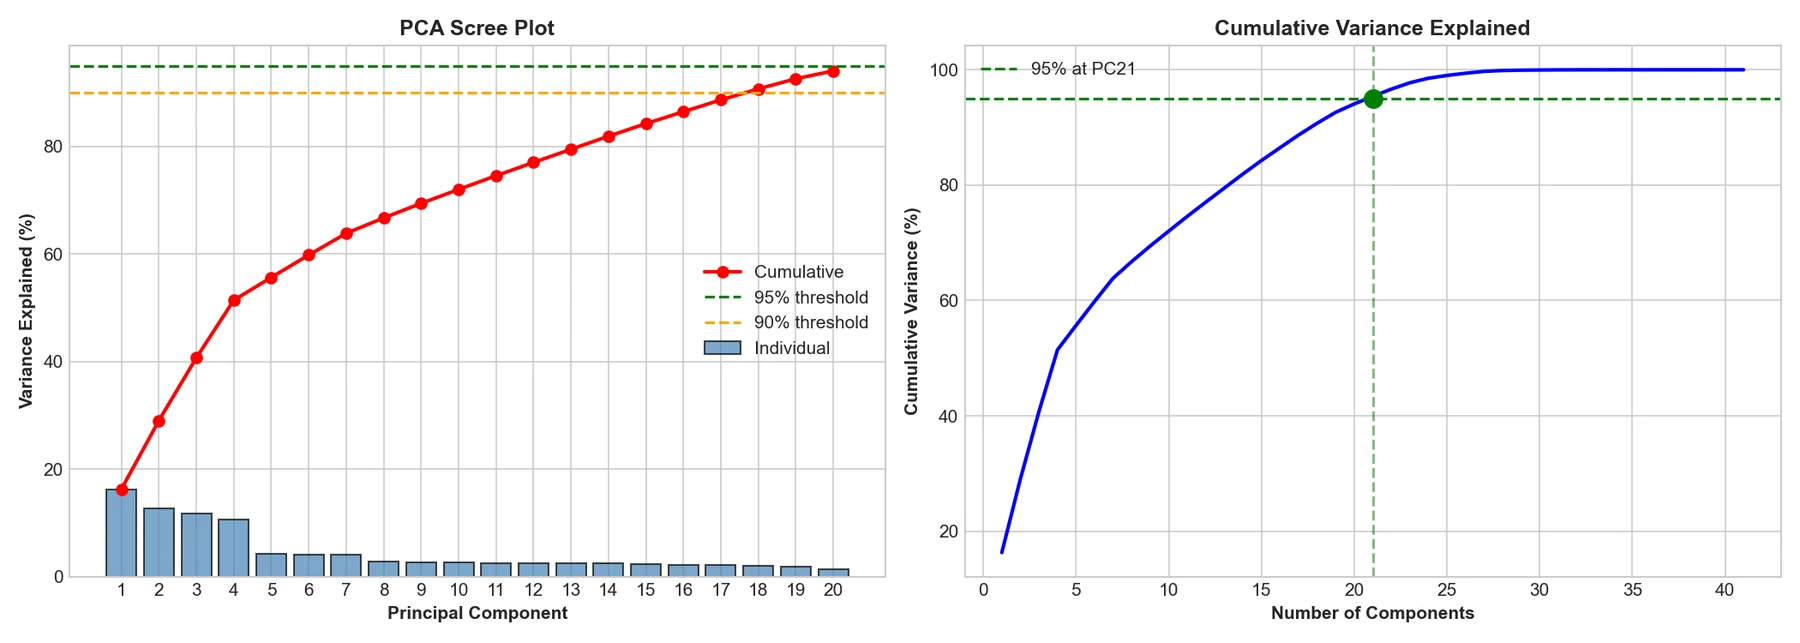
PCA over 41 numeric features needed 21 components for 95% of the variance: the first captured body composition and the second heart-rate intensity. The scatter of duration against calories falls on perfectly straight lines, a sign the dataset is synthetic, which the report notes as a limitation.
Section 03
Models
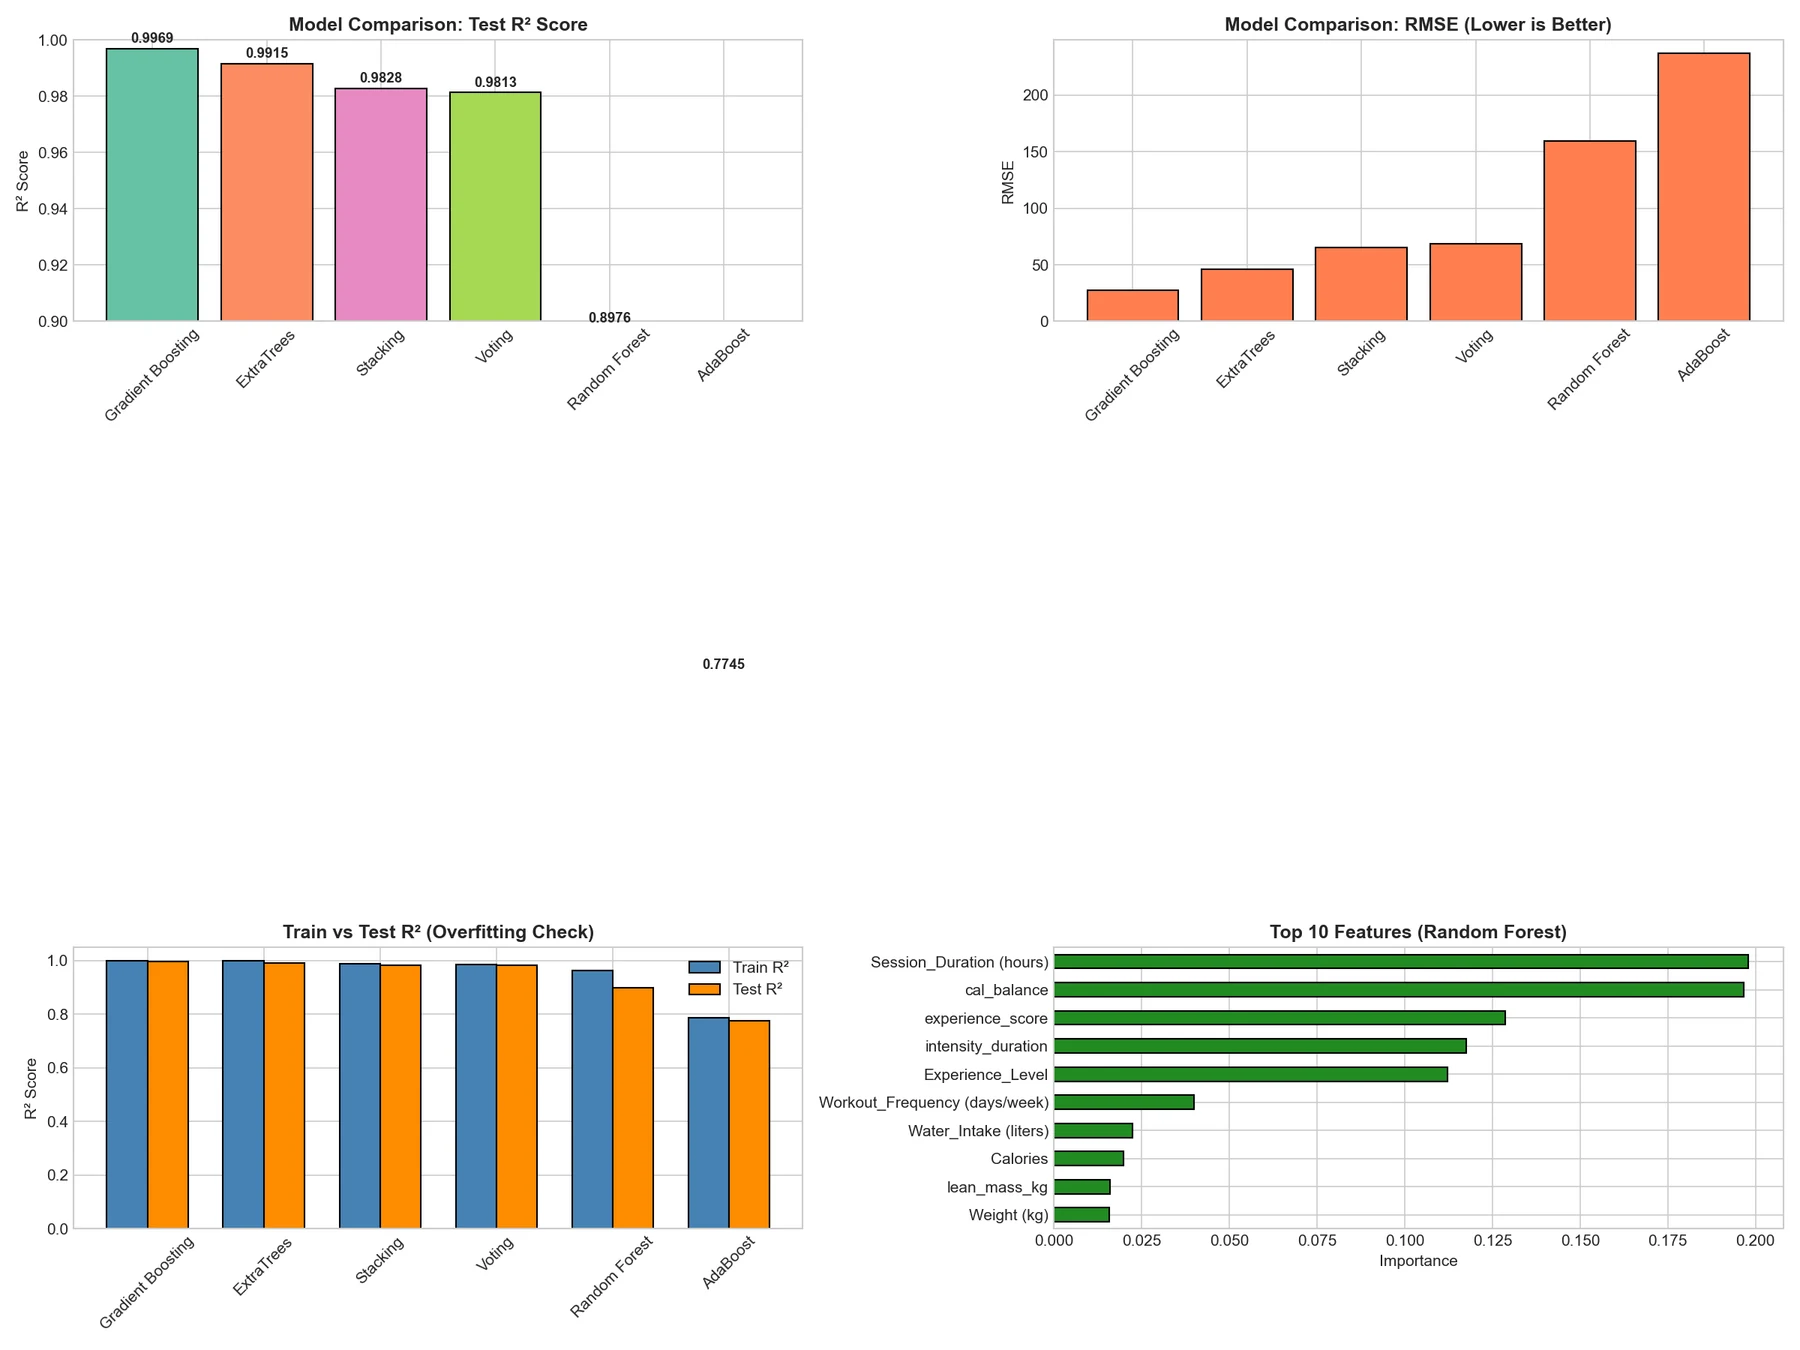
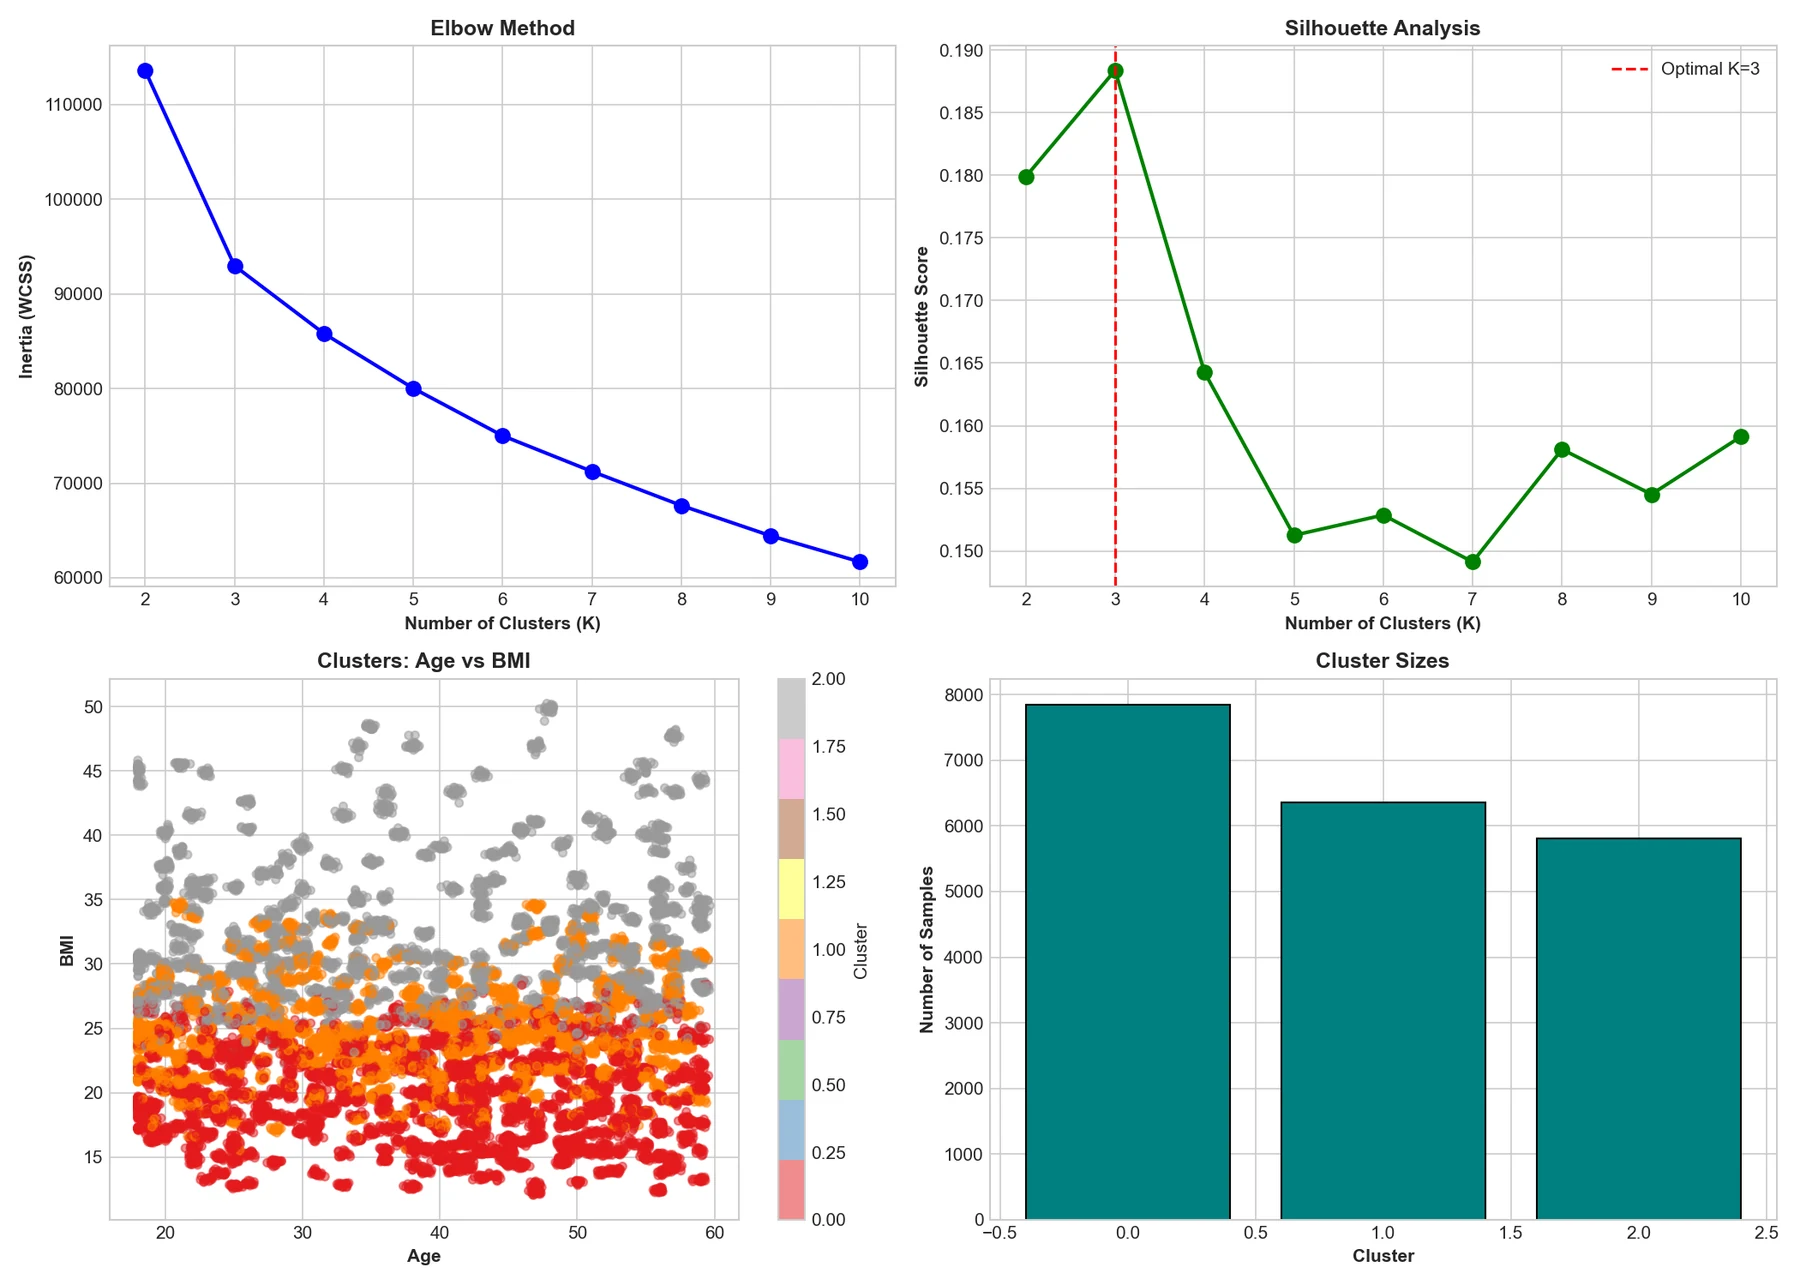
We compared six ensembles (Random Forest, ExtraTrees, AdaBoost, Gradient Boosting, stacking and voting), Lasso, Ridge and ElasticNet, SVR with three kernels and four neural network sizes, then checked the strongest with 5-fold cross-validation and a learning curve. K-Means grouped sessions into three loose personas (silhouette about 0.19).
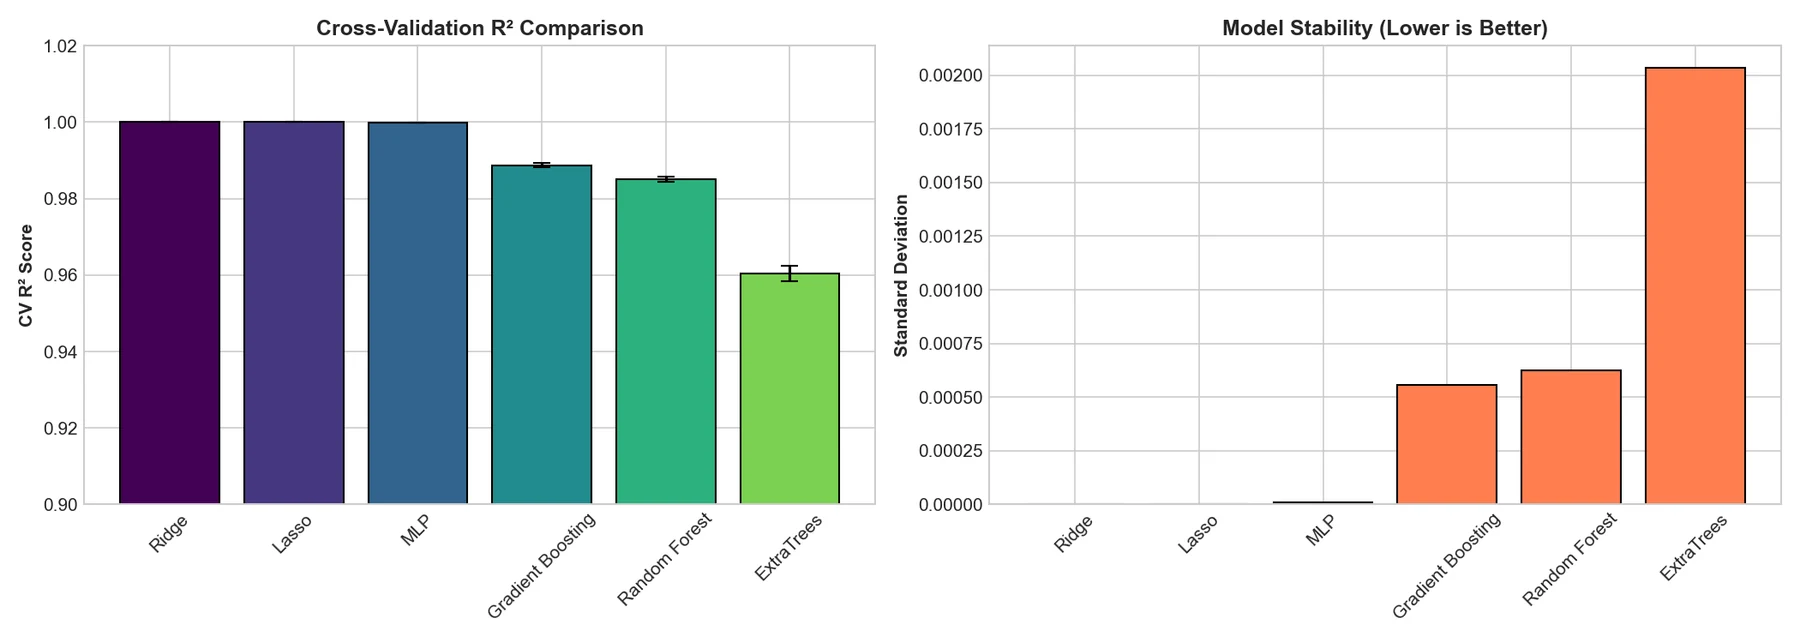
As submitted, Gradient Boosting won with test R² 0.997 and RMSE 27.7 calories, and 0.989 in cross-validation.
Section 04
Why 0.997 Was Too Good
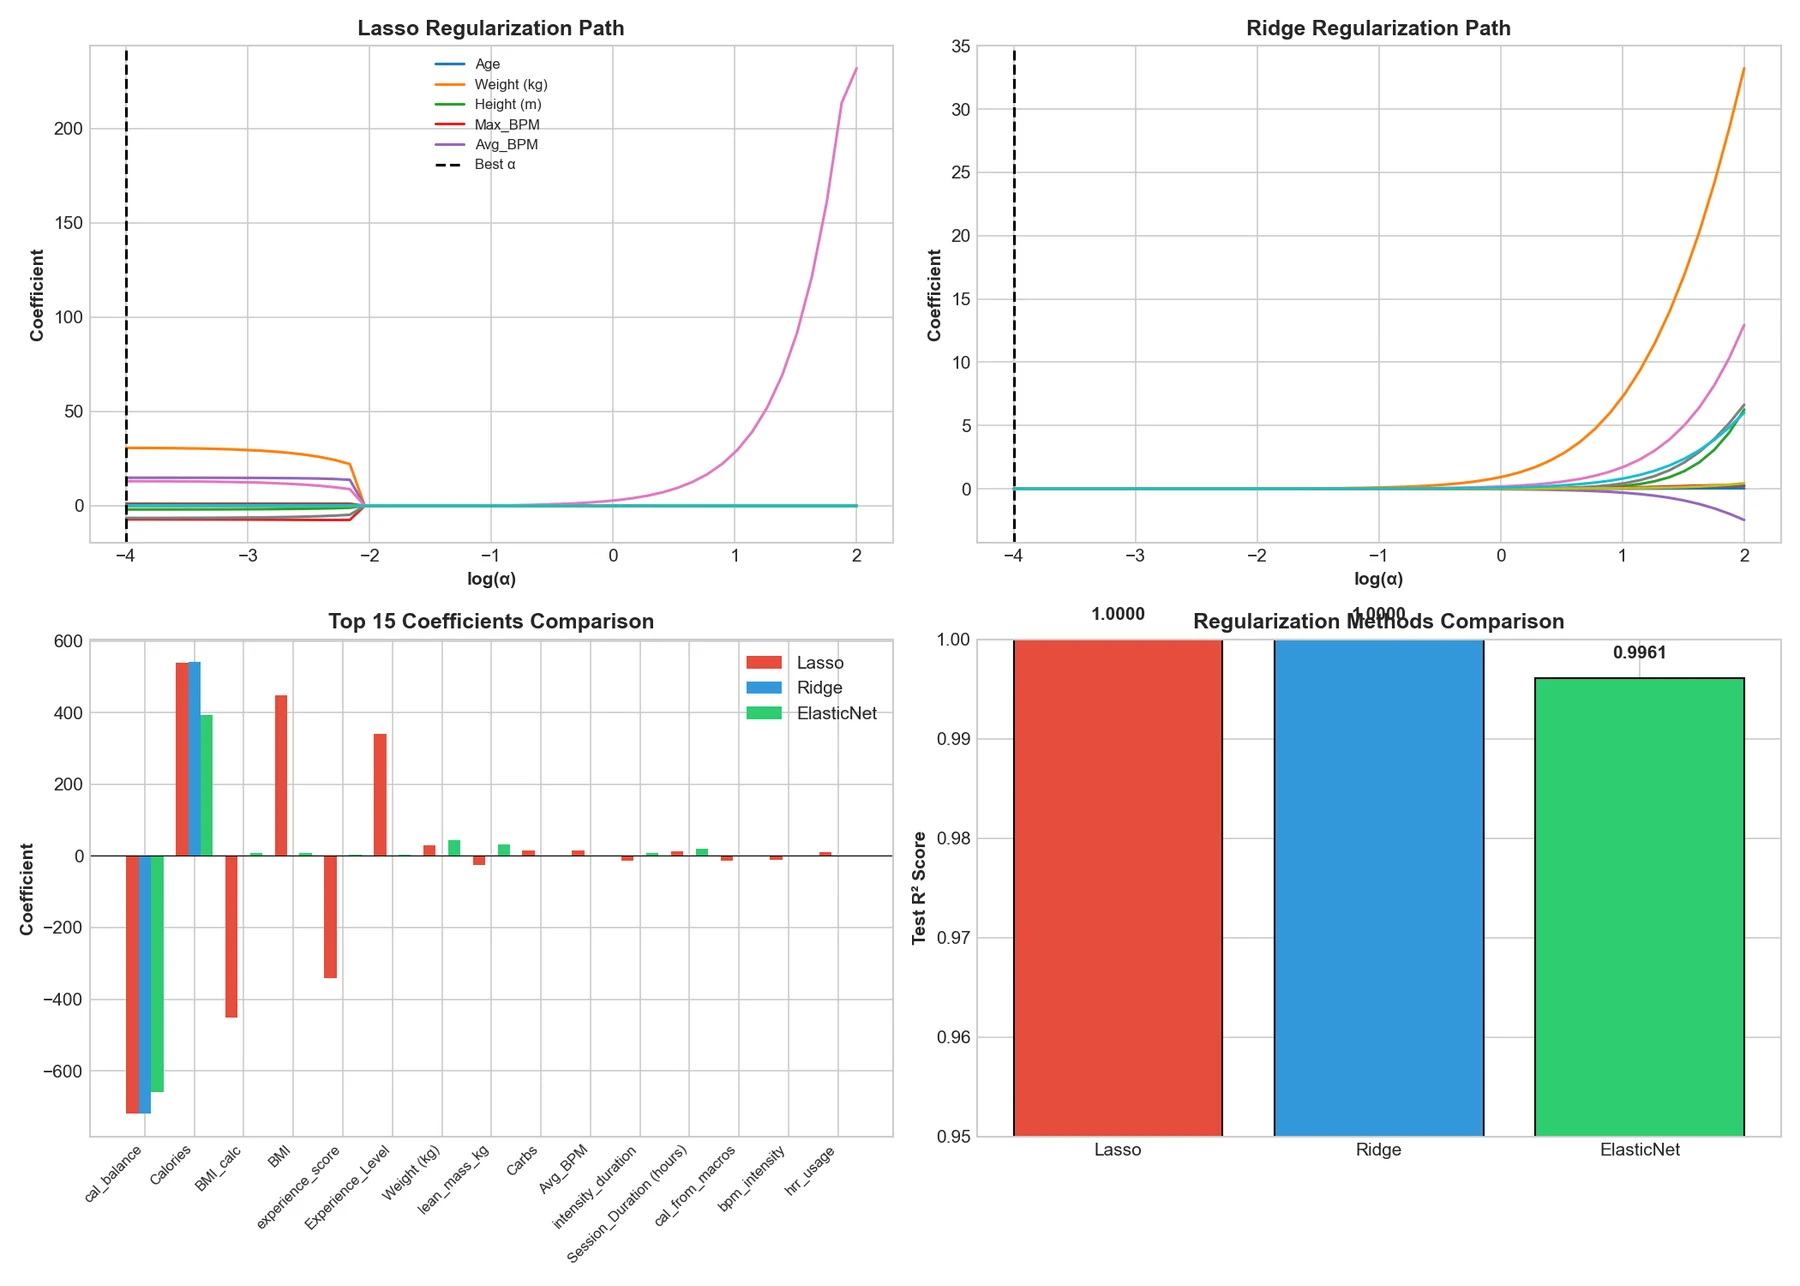
Plain Ridge and Lasso scored a perfect 1.000. A linear model fitting exactly means some input already contains the answer. The culprit was cal_balance, a column that ships with the dataset and equals calorie intake minus calories burned, checked on all 20,000 rows. With intake also in the inputs, the target was a simple subtraction away.
We had excluded three other leaky columns, but missed this one. Rerunning the same Gradient Boosting setup without cal_balance drops test R² to 0.65. Adding back workout type, which the pipeline had silently dropped as a text column, lifts it to 0.9999 on this synthetic data: the honest finding is that duration, workout type and experience level almost fully determine the target here, which says little about real wearable data.
Section 05
What I Took From It
The broad pipeline was the assignment; the leak was the lesson.
- A perfect score from a simple model is a bug report, not a result
- Check every engineered or pre-derived column for a path back to the target
- Encode categorical columns explicitly instead of selecting numeric types and losing them
- Synthetic data can validate a pipeline but not a real-world claim