AI / MLResearch2026
After Fire
An interactive atlas of post-wildfire recovery in BC's Thompson-Okanagan, turning a machine-learning study into a map, a recovery simulator and a native-species planting guide.
- 2,600
- Burned sites in the study
- 6
- Open datasets merged
- 0.717
- Weighted F1, cross-validated
Timeline
2026, alongside the research grant
Role
Research, modelling and front end
Team
Solo, supervised by Dr. Ghazanfar Latif
Domain
Environmental science · Wildfire recovery · Forestry
Status
Research
Stack
Source
Section 01
Overview
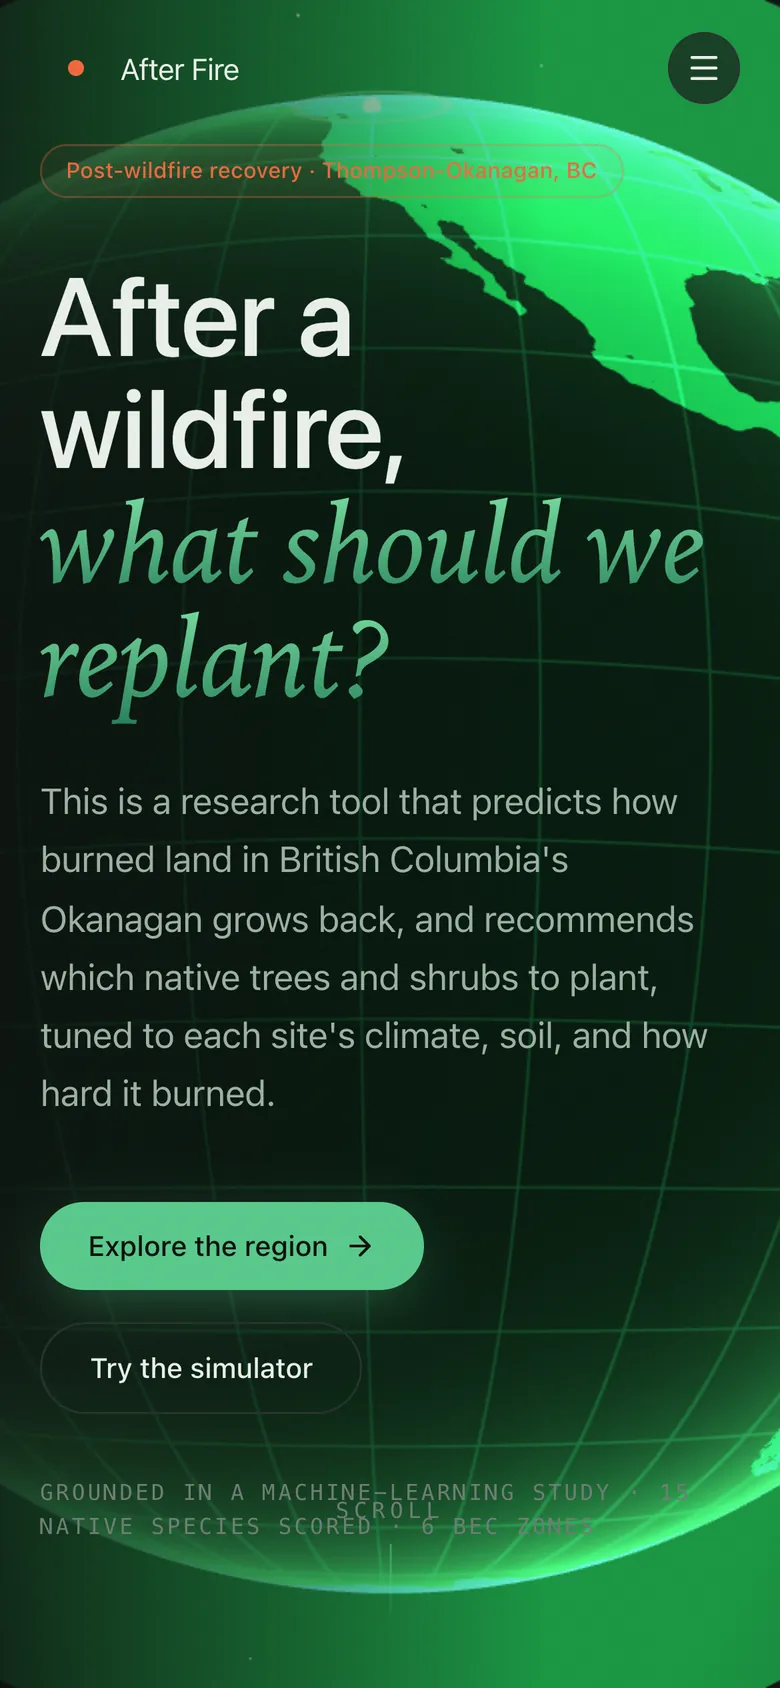
After a wildfire, land managers have to decide what to replant, and the answer depends on how hard the ground burned, how dry the climate is and which ecosystem the site sits in. My research predicts three-year vegetation recovery for burned land in British Columbia and scores native species for each site.
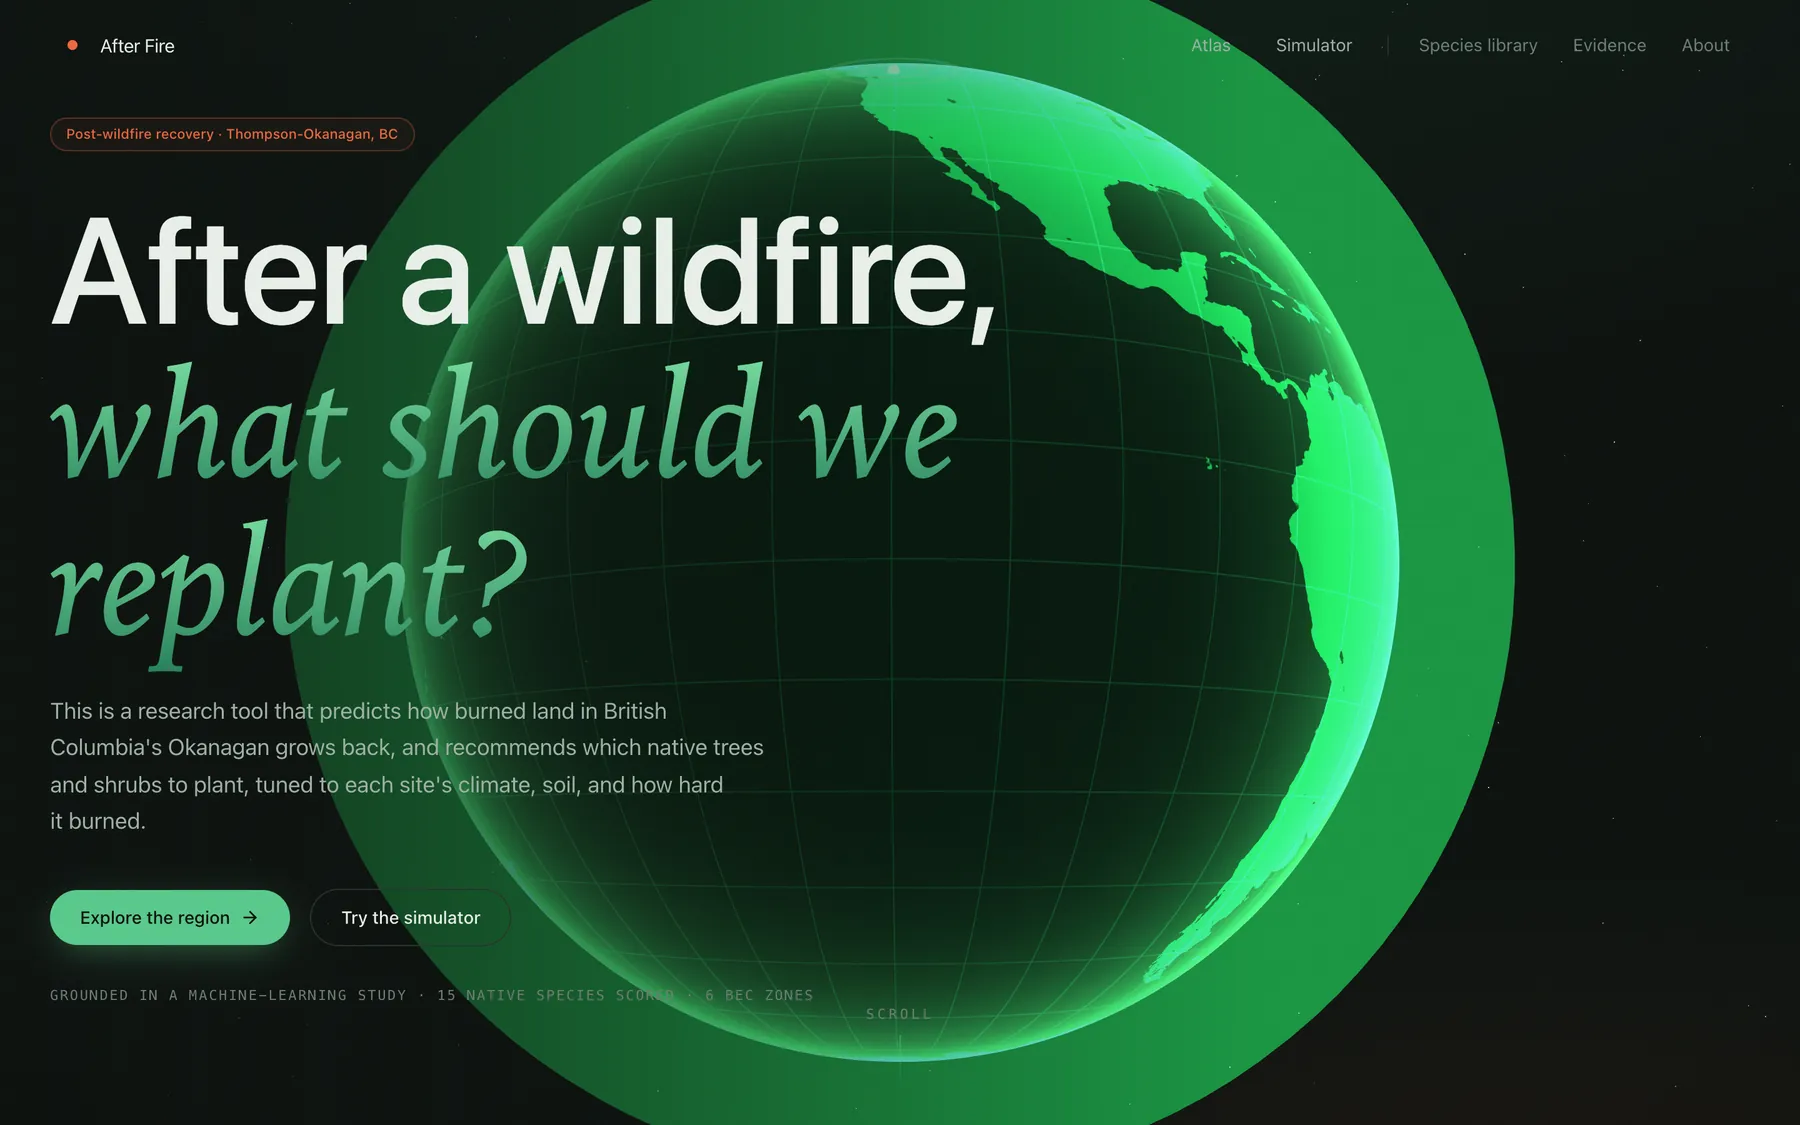
After Fire is the public face of that study. Instead of a PDF, it is a site anyone can explore: a WebGL globe that dives into BC, a 3D terrain atlas of landmark fires and study sites, a recovery simulator, a species library, and an Evidence page that shows the model's results, including where it fails. Every technical term opens a plain-language definition, because the audience is land managers and communities, not data scientists.
Section 02
The Problem
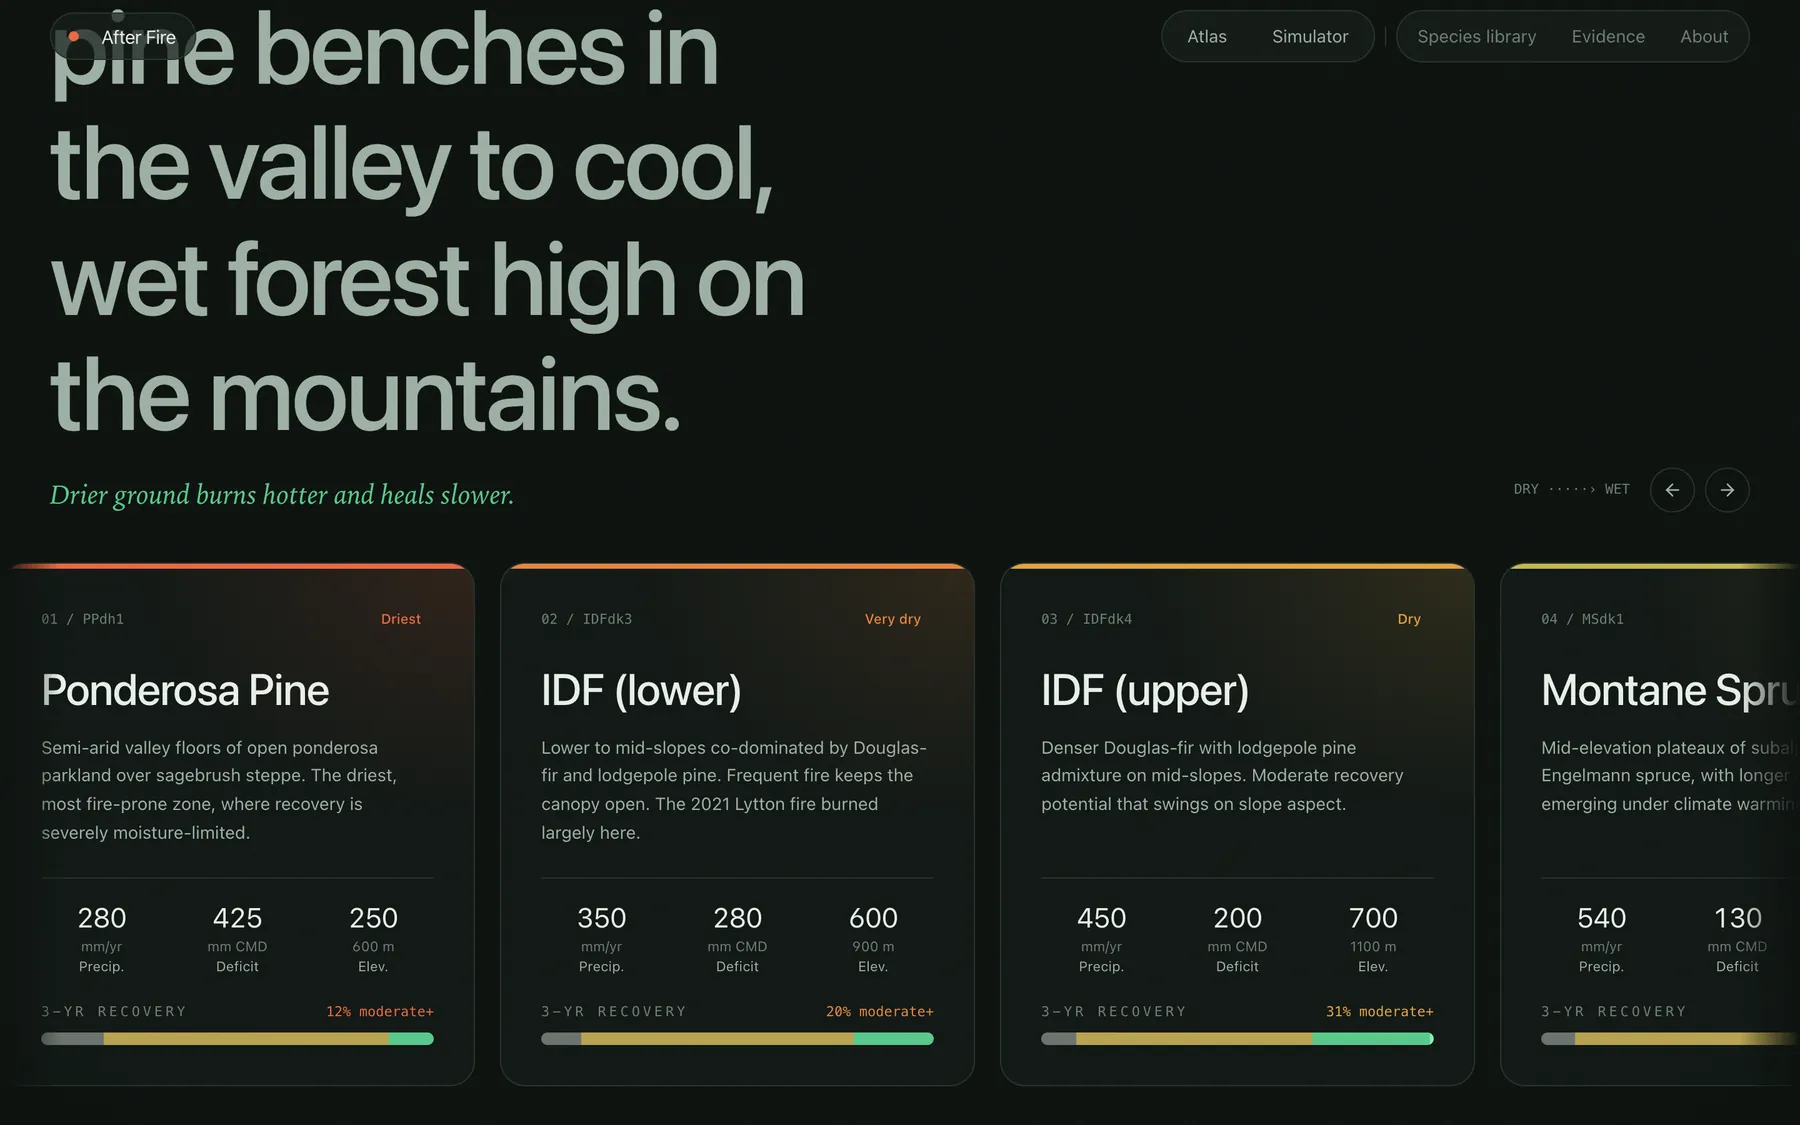
Canada's 2023 fire season burned about 18 million hectares, more than double the previous record. Recovery is not uniform. In the study data, the share of sites reaching moderate or better recovery rises from 11.5% on the driest ponderosa pine benches (PPdh1) to 37.7% in the wetter sub-boreal spruce zone (SBSmc2).
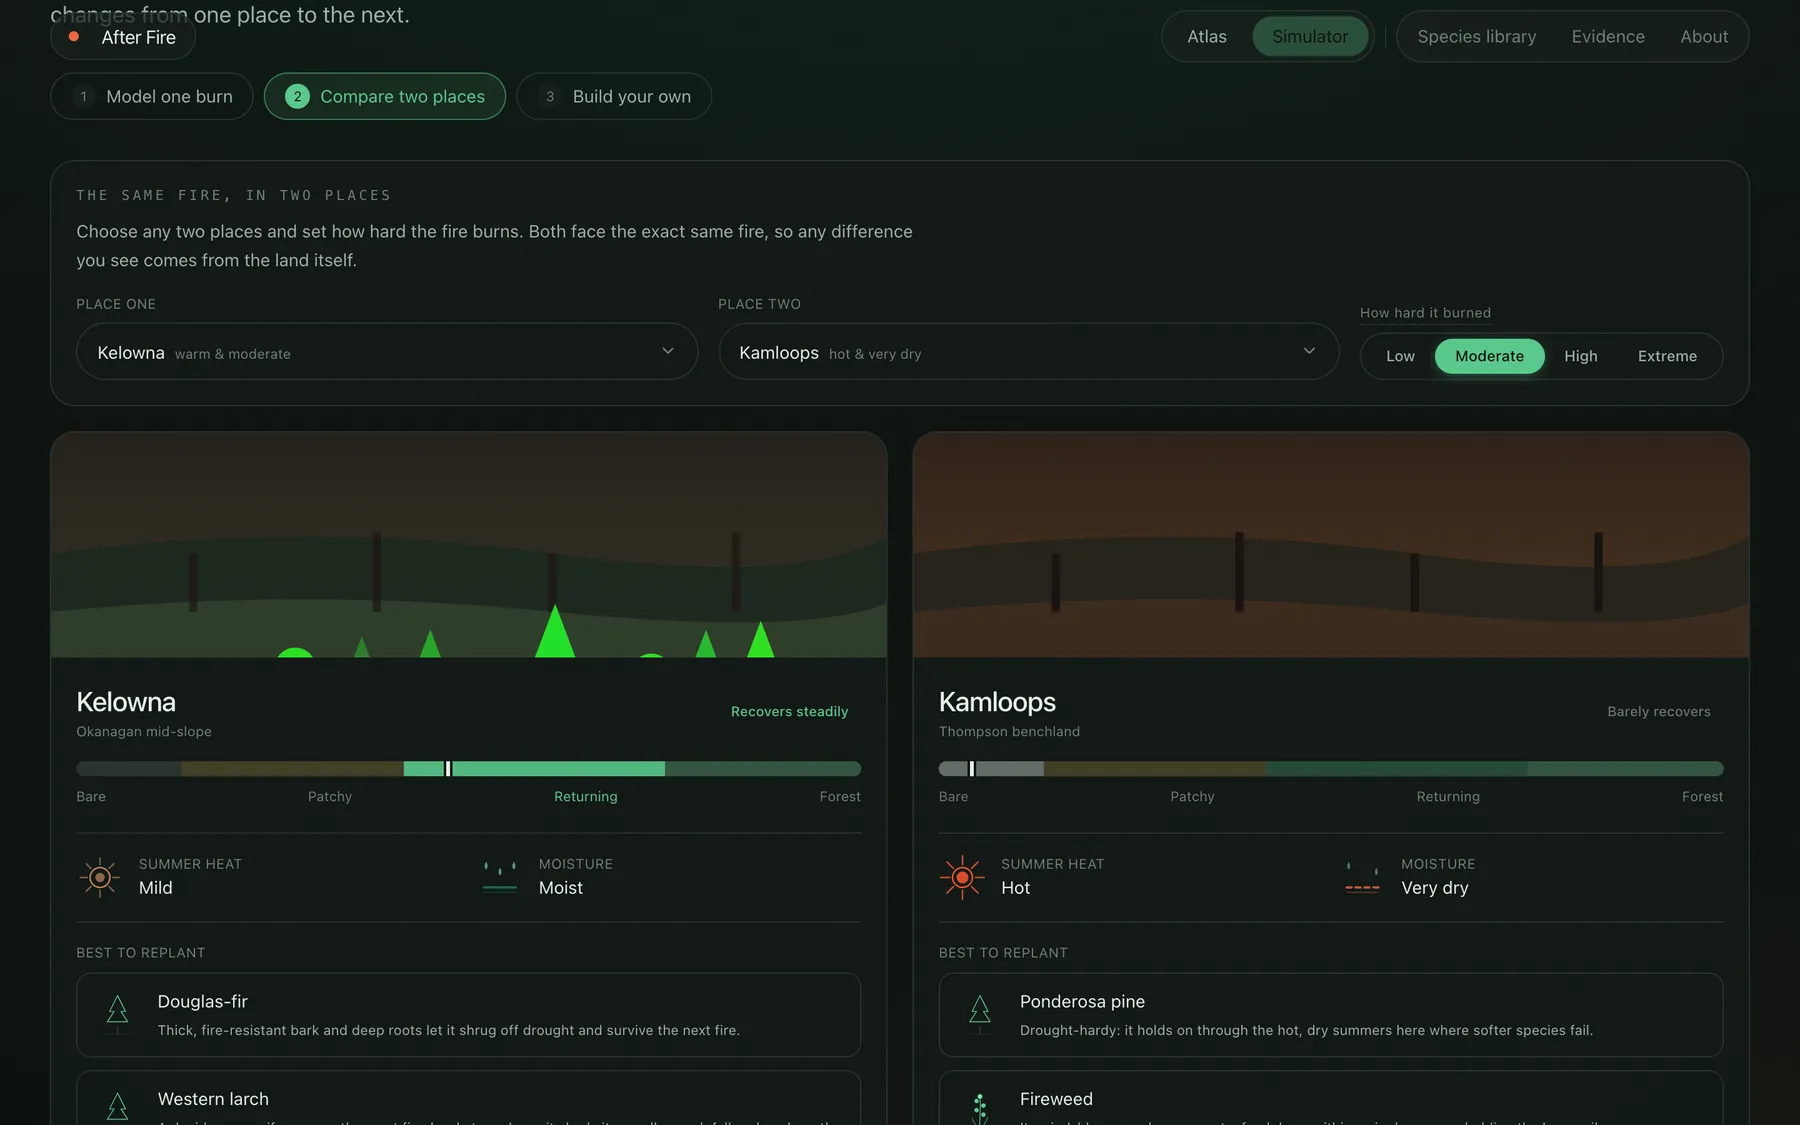
The same fire in two places needs two different prescriptions, so the tool has to make the role of place visible, not just output a class label.
Section 03
Data and Model
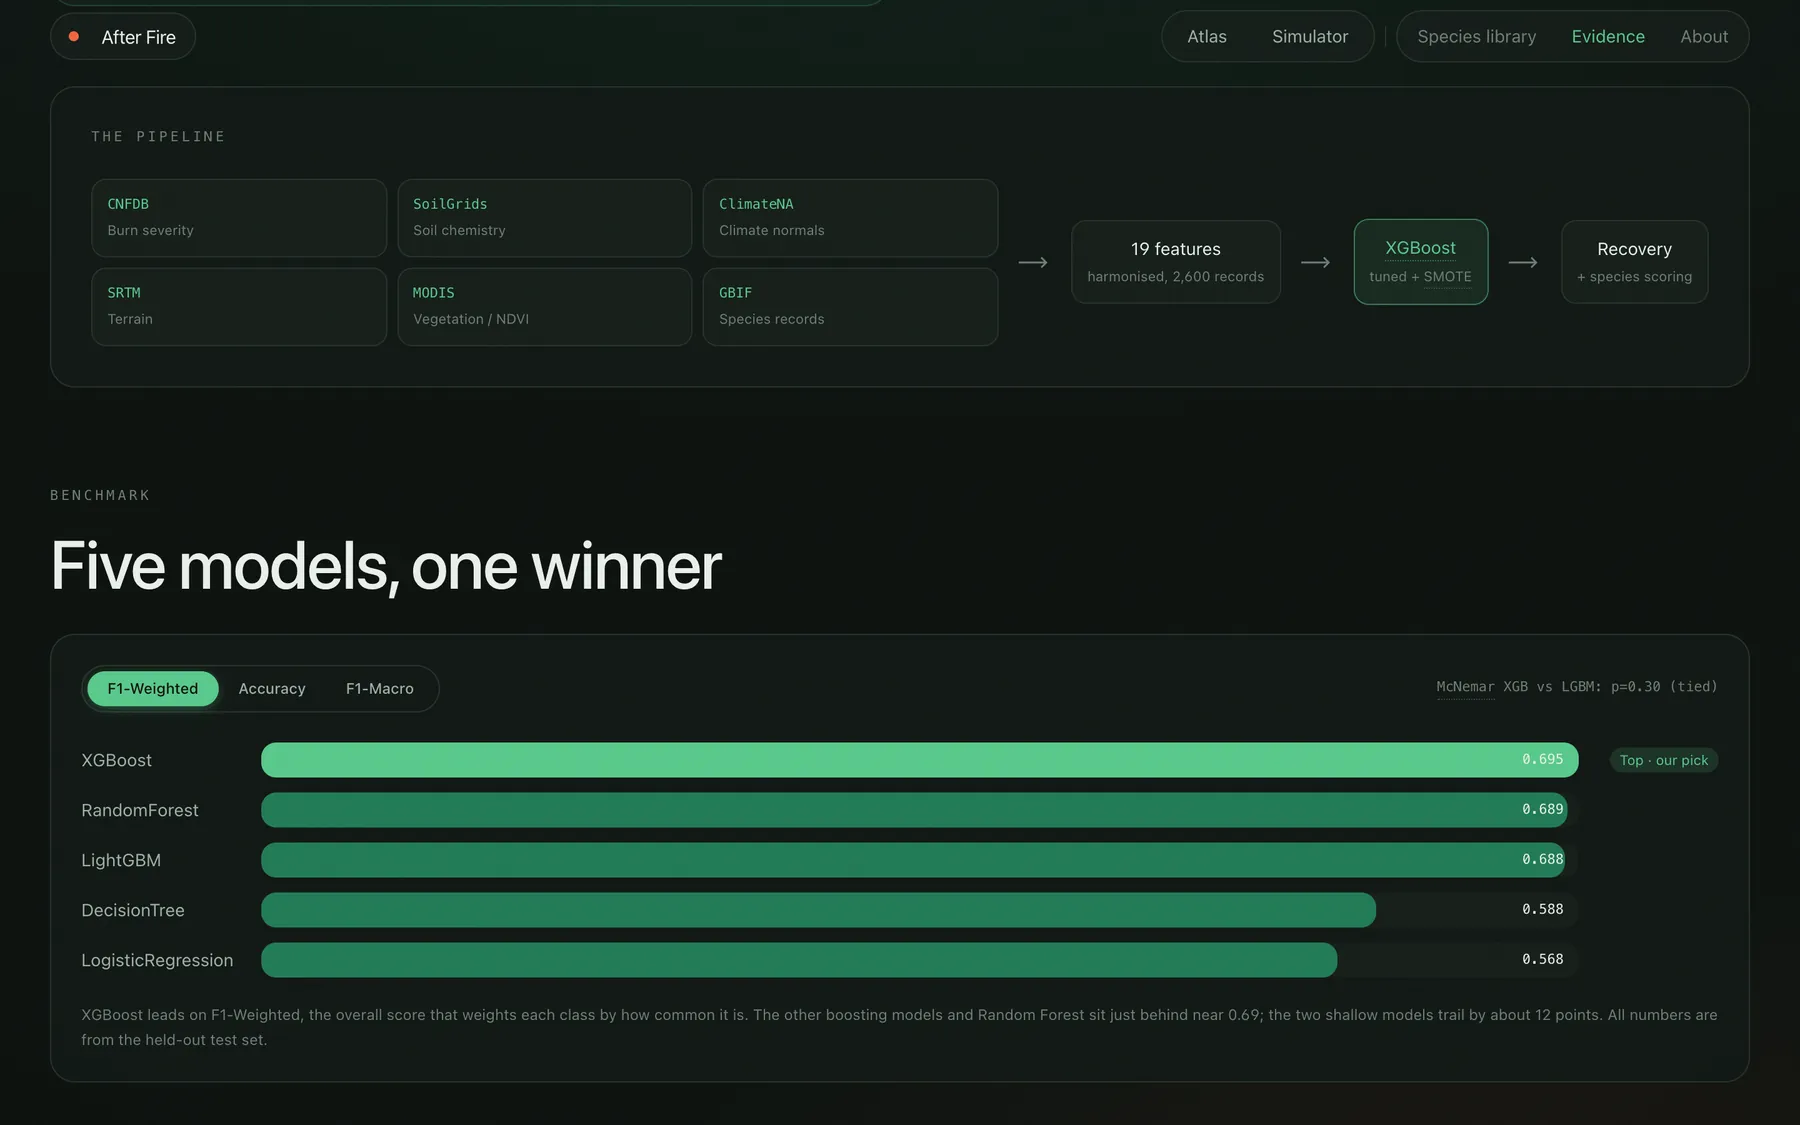
I merged six open datasets: CNFDB/CIFFC fire perimeters and burn severity, SoilGrids 2.0, ClimateNA, SRTM terrain, MODIS vegetation greenness (NDVI) and GBIF species records. The result is 2,600 burned sites across six BEC zones, described by 19 features. Recovery is defined from NDVI three years after the fire.
Five classifiers were benchmarked with SMOTE for the class imbalance. XGBoost led on held-out weighted F1 (0.695) and in cross-validation (0.717 ± 0.009). A McNemar test against LightGBM gave p = 0.30, so I report the two as statistically tied rather than claiming a clear winner.
A Python export script turns the research outputs into versioned JSON, so the site deploys as static pages with no Python, database or server in production.
Section 04
What Drives Recovery
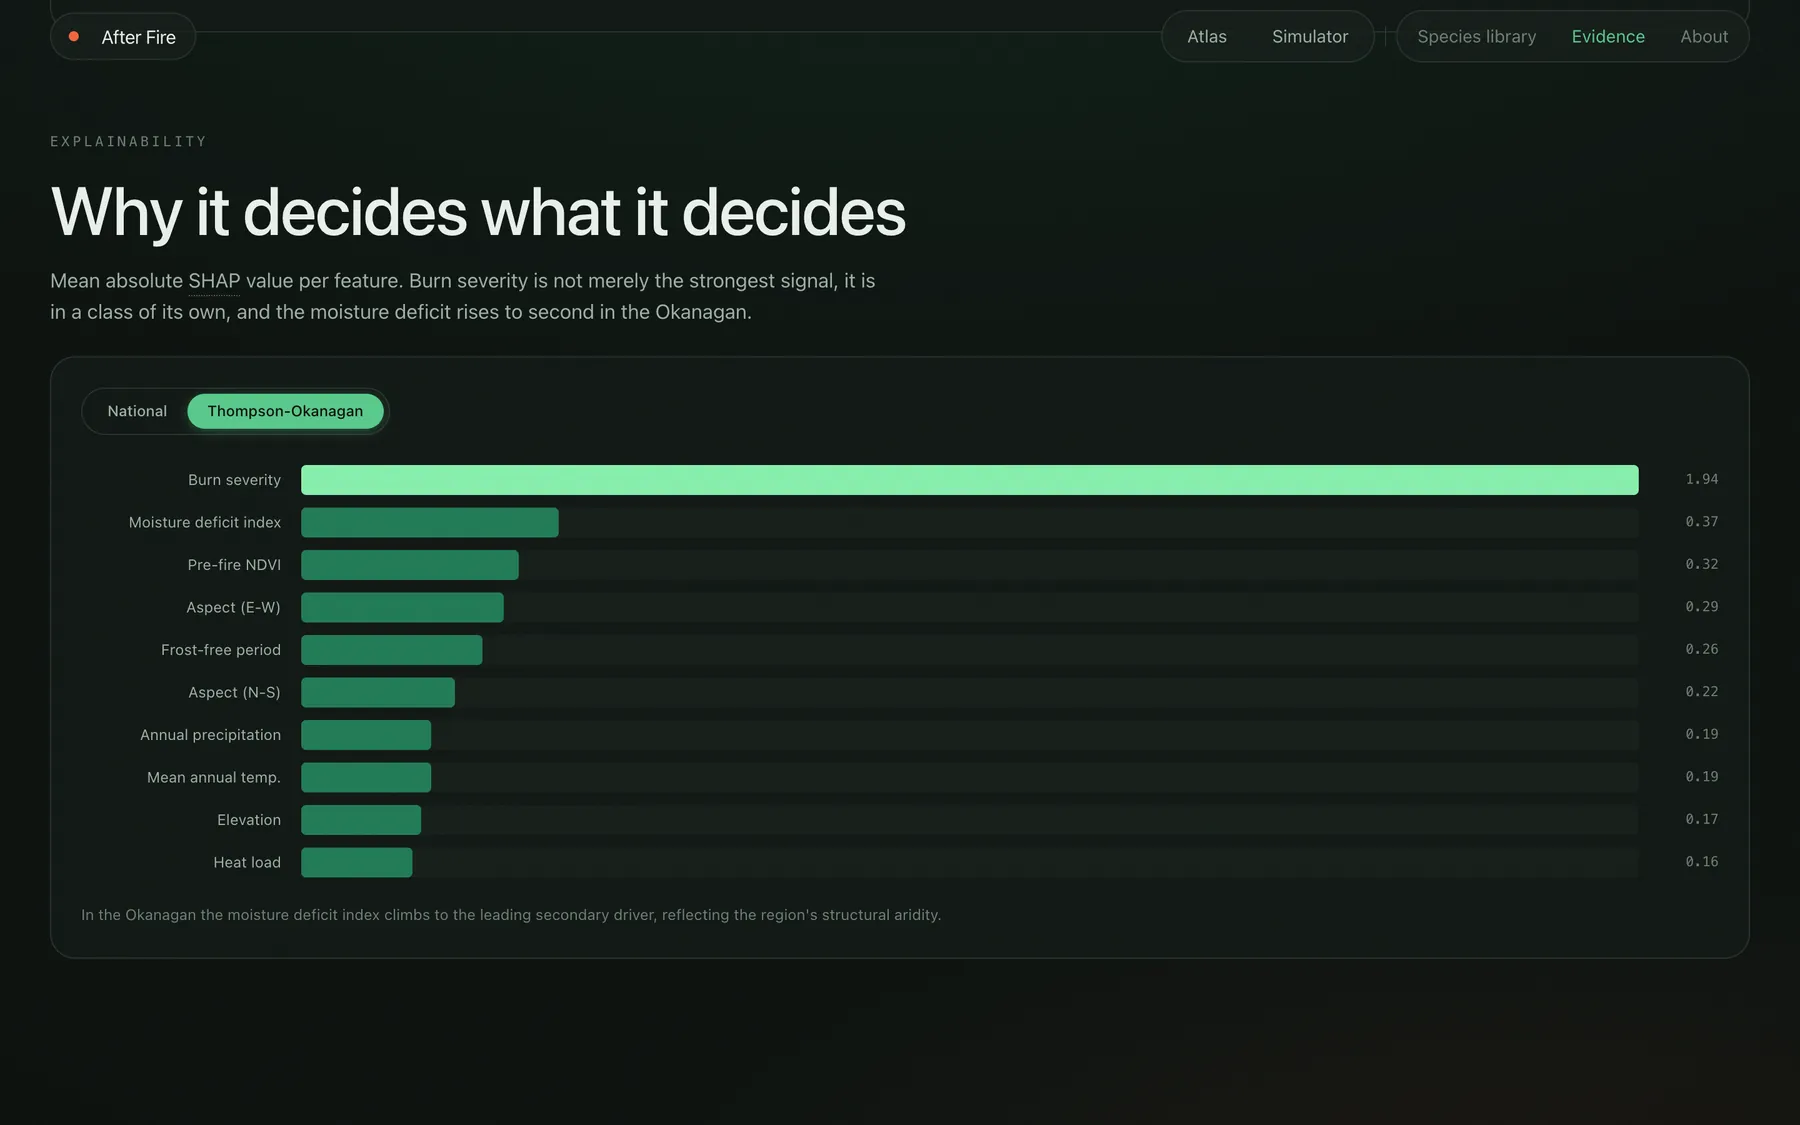
SHAP explains the model's decisions. Burn severity dominates everywhere (mean |SHAP| 2.08, about six times the next feature). In the Thompson-Okanagan the moisture deficit climbs to second place, which matches the region's dry climate.
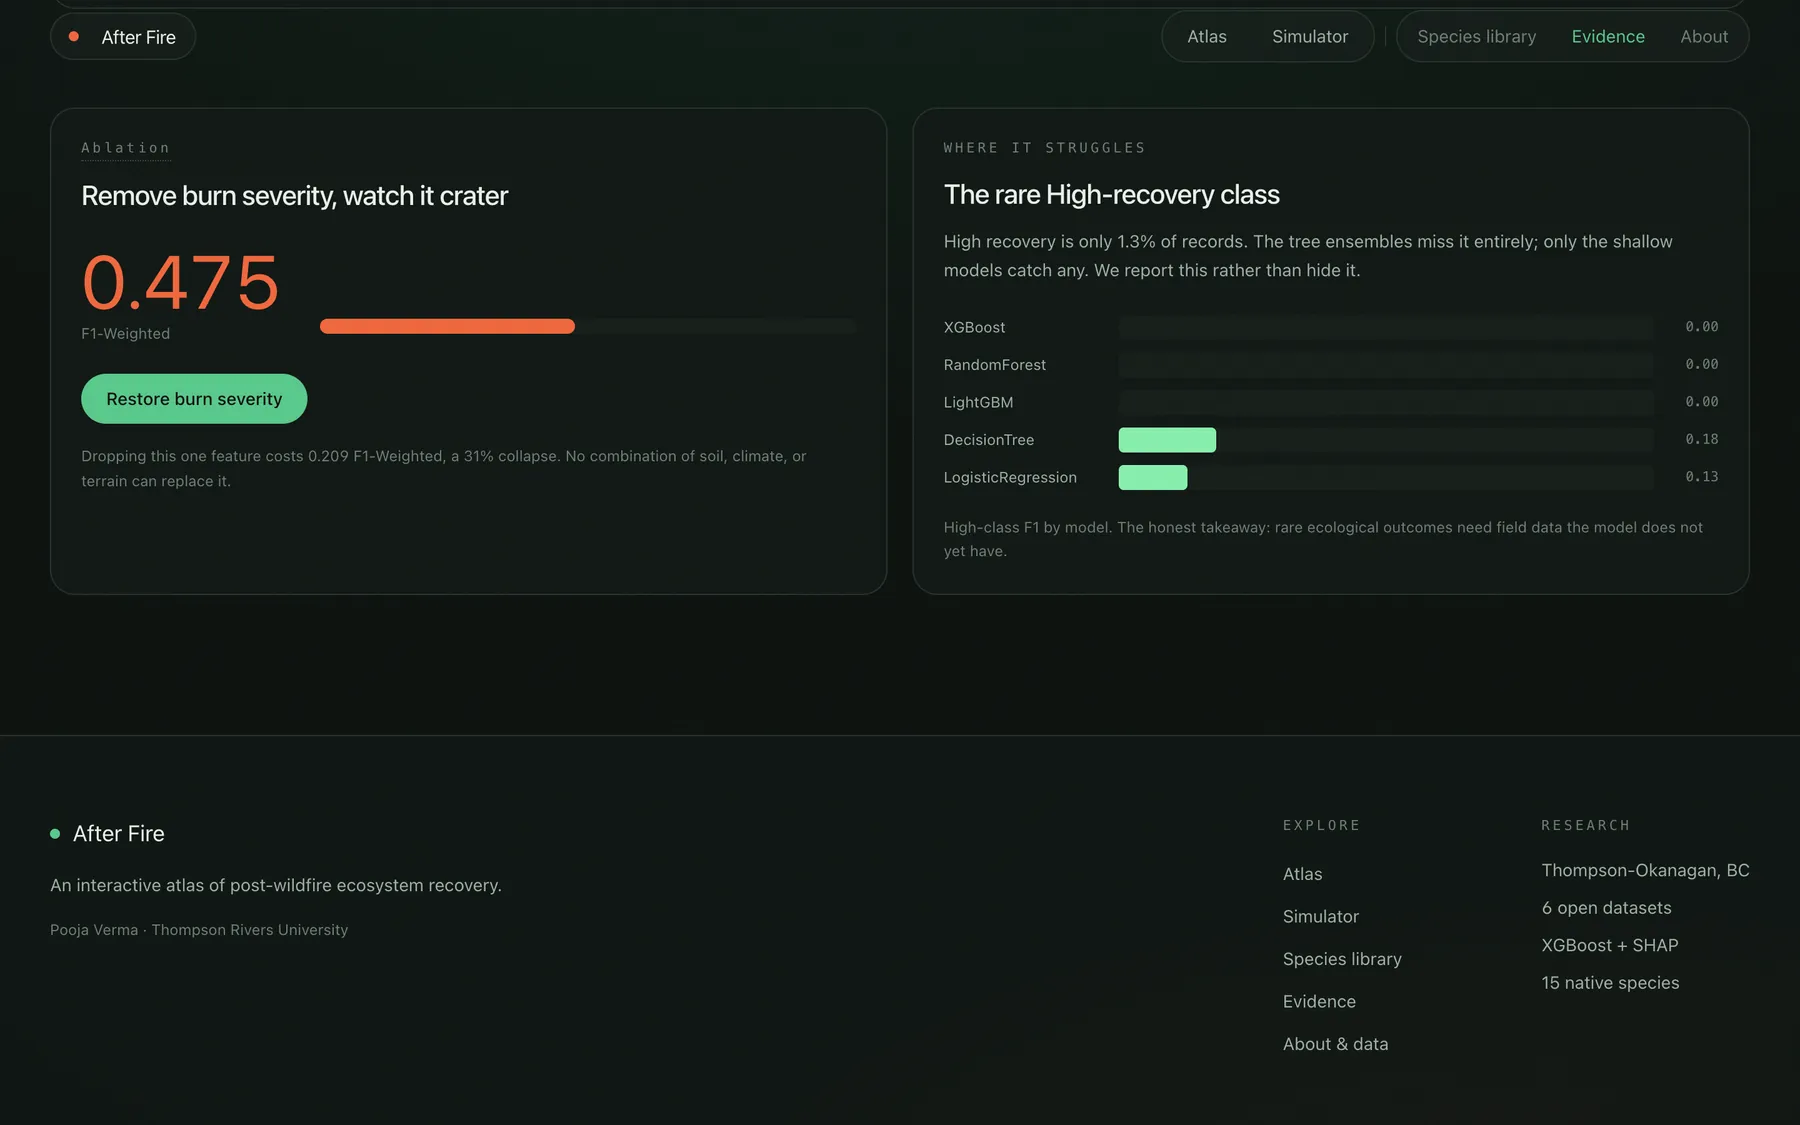
An ablation makes the point concrete: removing burn severity drops weighted F1 from 0.684 to 0.475. The page also reports where the model struggles. The High-recovery class is only 1.3% of records and every tree ensemble scores 0 F1 on it, which I show rather than hide.
Section 05
Interface
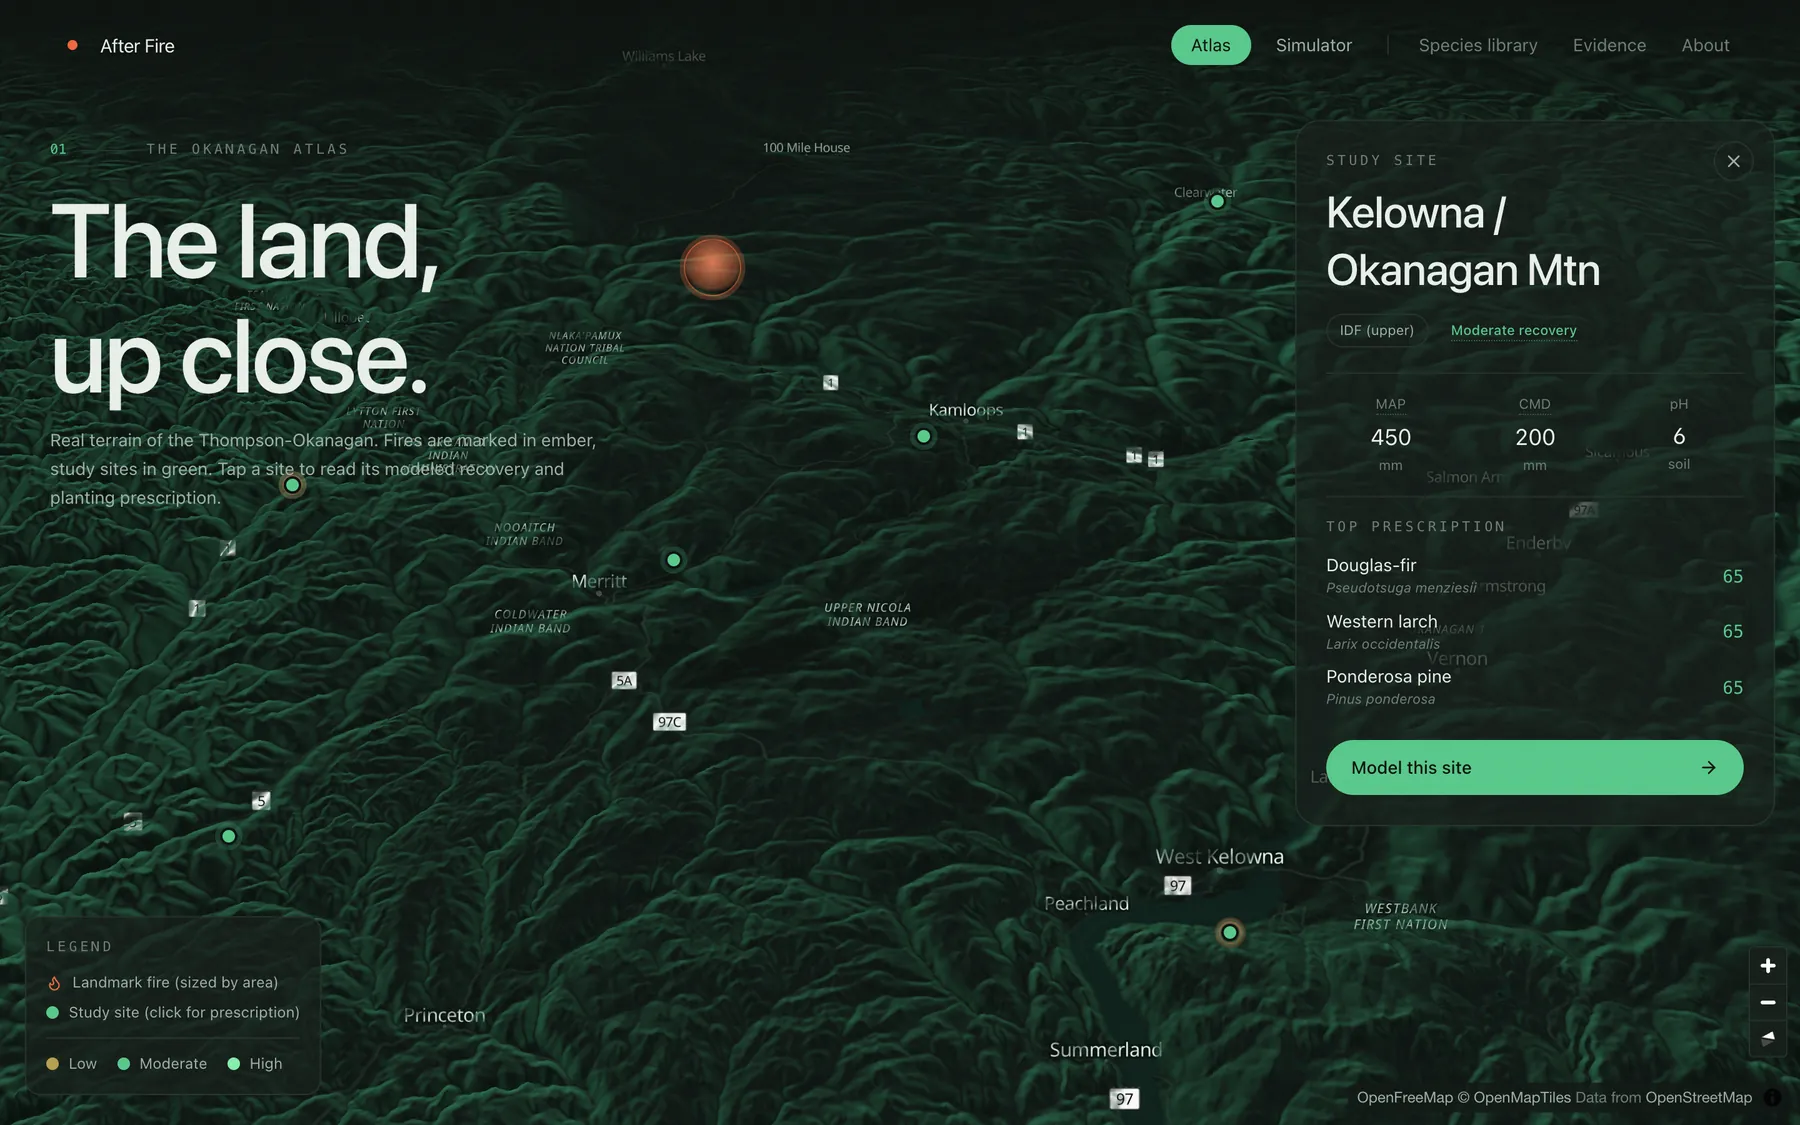
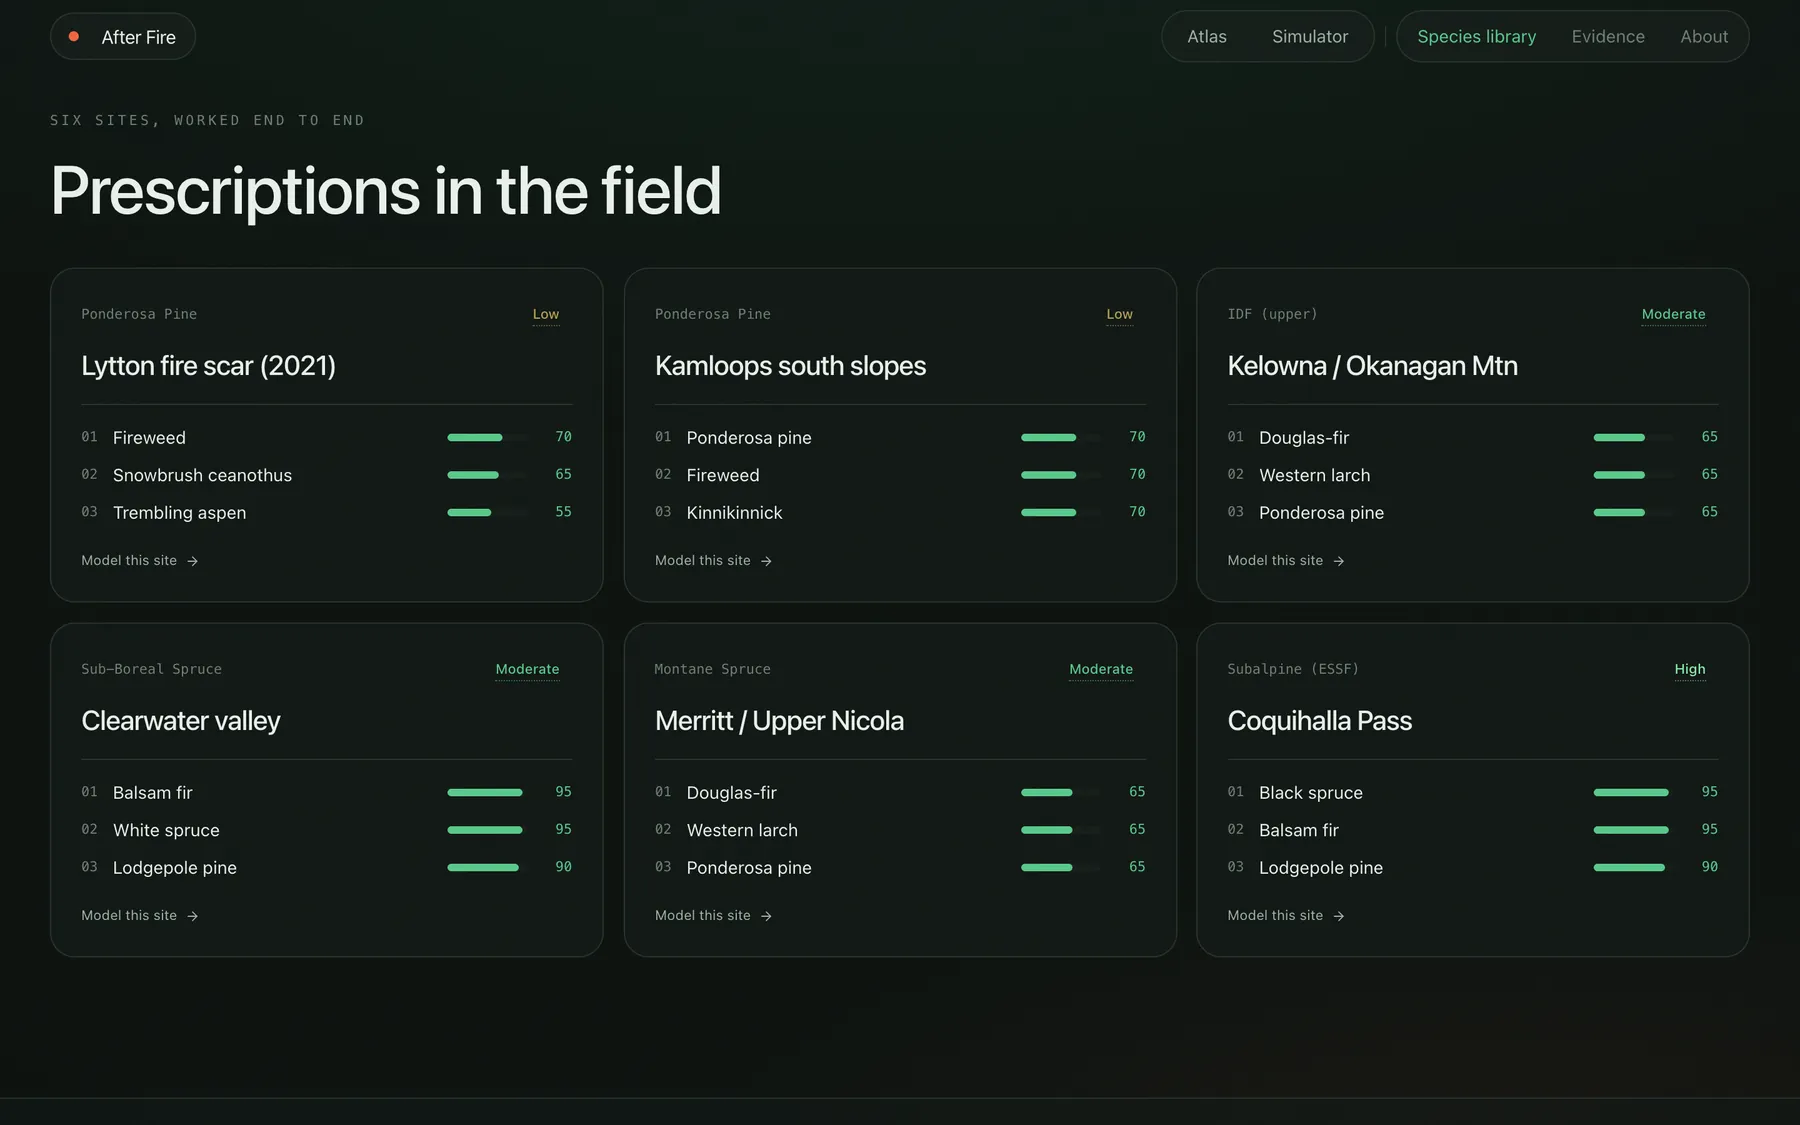
The atlas puts landmark fires (Okanagan Mountain Park, Elephant Hill, Lytton Creek) and six study sites on real 3D terrain with MapLibre. Each site opens its modelled recovery class and a ranked planting prescription.
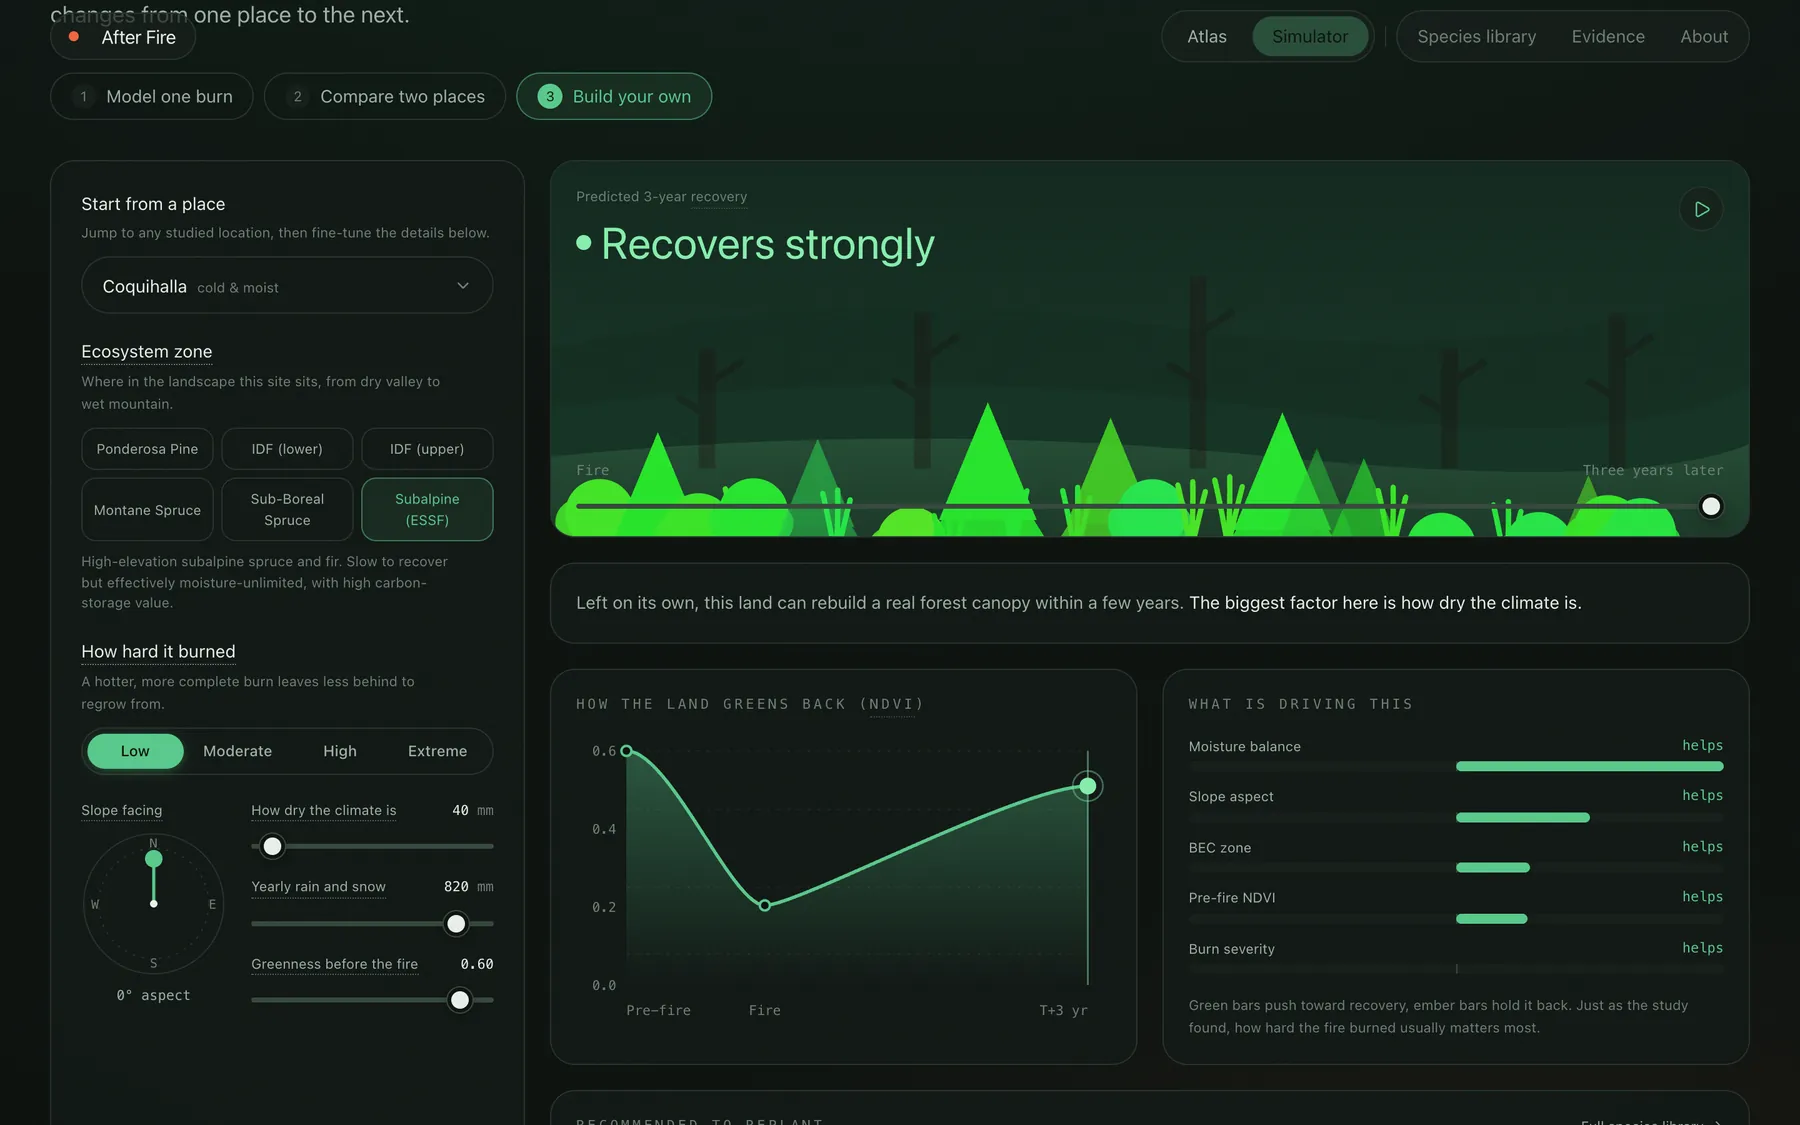
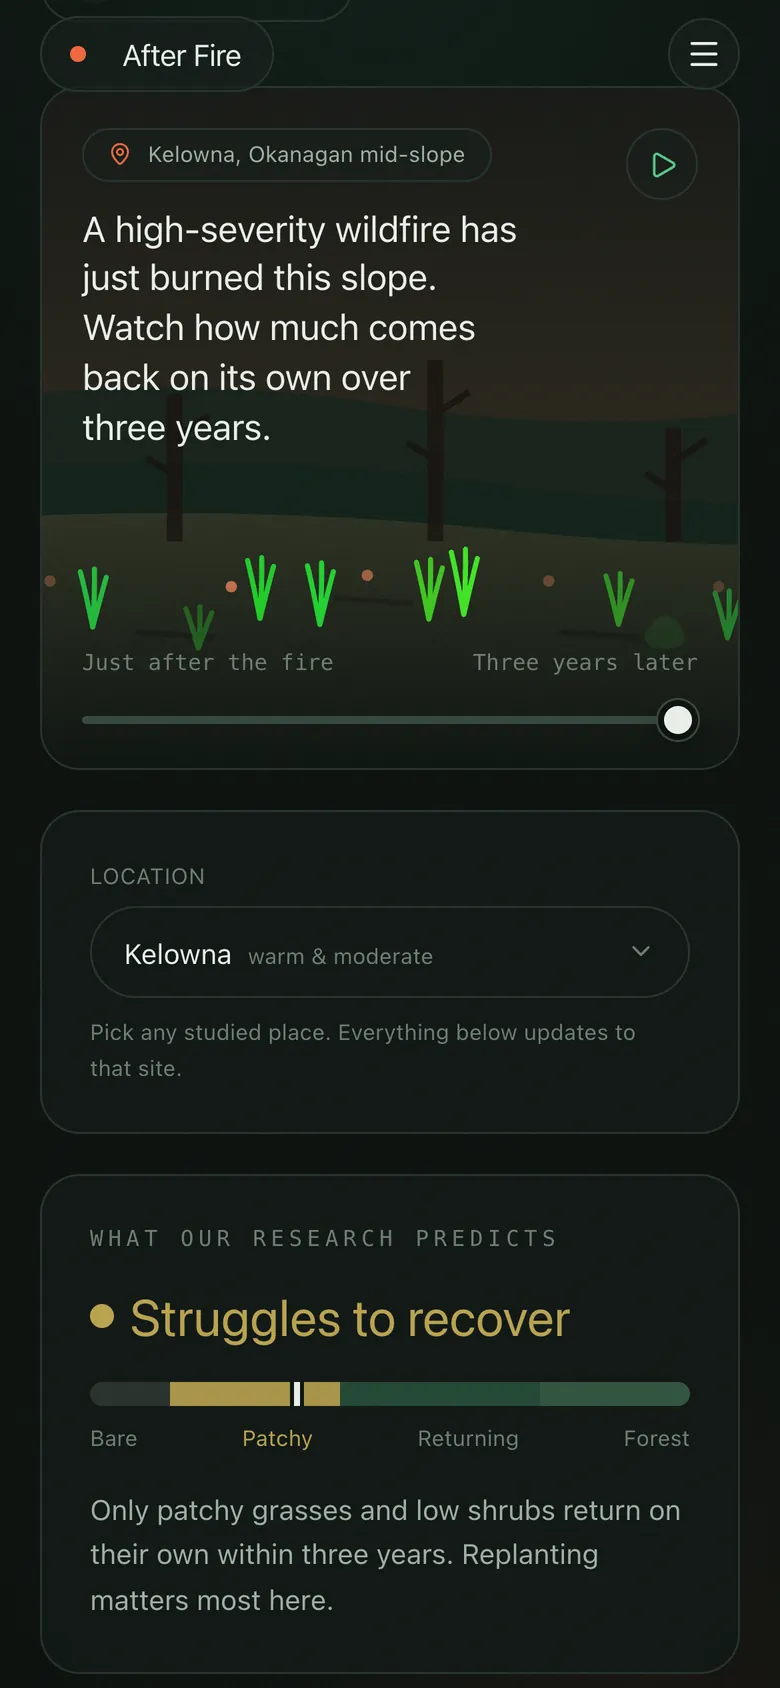
The simulator regrows a burned slope over three years as you change zone, severity, aspect, dryness and pre-fire greenness. It runs a transparent surrogate calibrated to the study's NDVI data rather than the trained model, so every slider move can explain its own effect in the driver bars.
The species scorer is a TypeScript port of the study's seven-criterion recommender. A Vitest suite checks it against the Python output for all six study sites: 9 of 9 tests pass.
Section 06
Results
The study shipped as a static Next.js site where every chart traces back to the research outputs. It was presented at the TRU Sustainability Conference.
- 2,600 burned sites, 6 open datasets, 19 features, 5 benchmarked models
- XGBoost at 0.717 weighted F1 in cross-validation, reported alongside its failure on the rare class
- Species recommender ported to the browser and verified against Python, 9 of 9 tests passing
- No backend in production: research outputs are exported to JSON at build time